LCA-GCS
2022–2024 · datasetLarge City Architecture: Generated Cityscape Set
- year
- 2022–2024
- type
- dataset
- status
- open dataset, CC BY-NC 4.0, Hugging Face, DOI 10.57967/hf/3111
- credit
- Daniel Koehler, The University of Texas at Austin, School of Architecture
- with
- Zidong Liu (Synthetic Data Types, 2023)
- program
- Latent Earth
- where
- Austin
- links
- Explorer on this site · Explorer on Hugging Face · largecityarchitecture.org (the earlier site) · Dataset on Hugging Face (CC BY-NC 4.0) · DOI 10.57967/hf/3111
- instrument
- Stable Diffusion 2.1, SDXL 1.0, SD3, Flux Dev · Punktiert/LCA-GCS · prompt grammar 'type in city', CLIP-score analysis
- no.
- 032
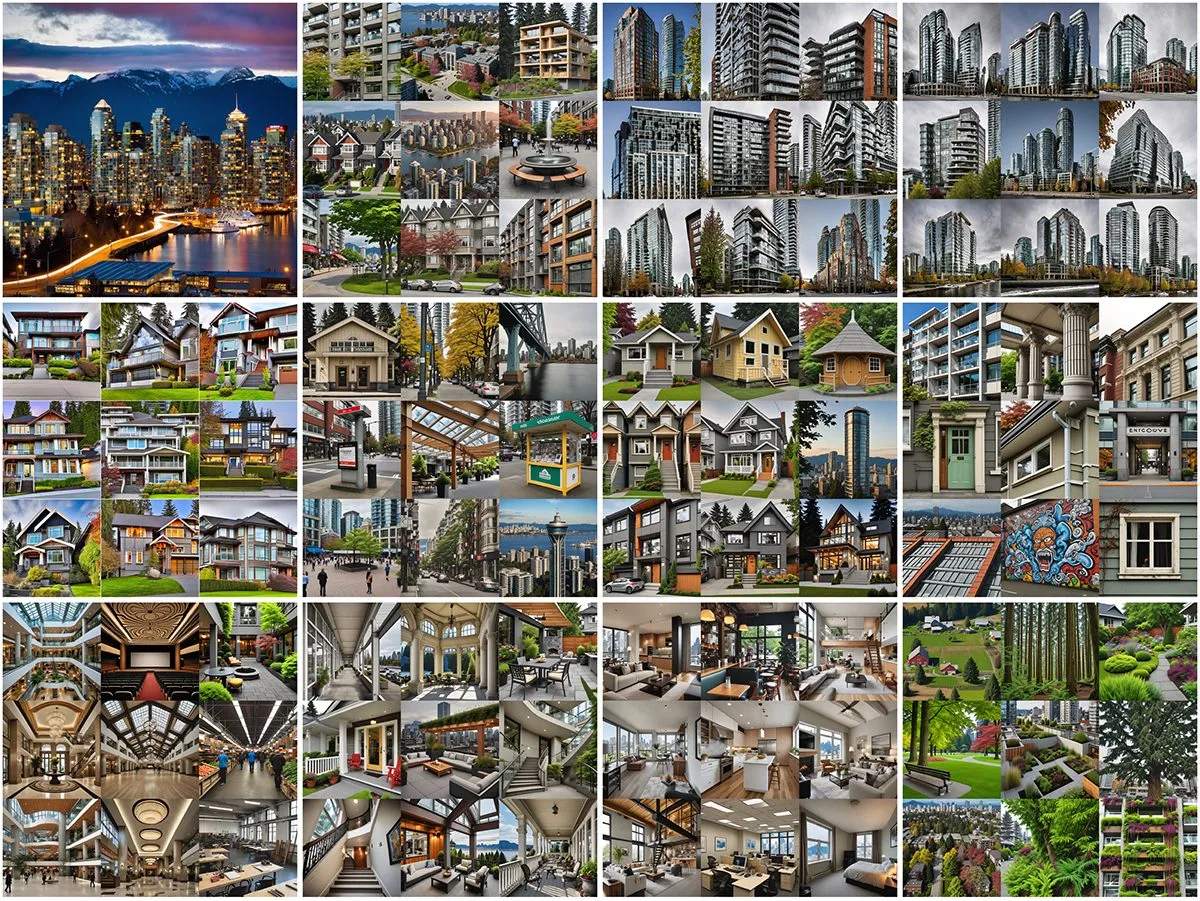
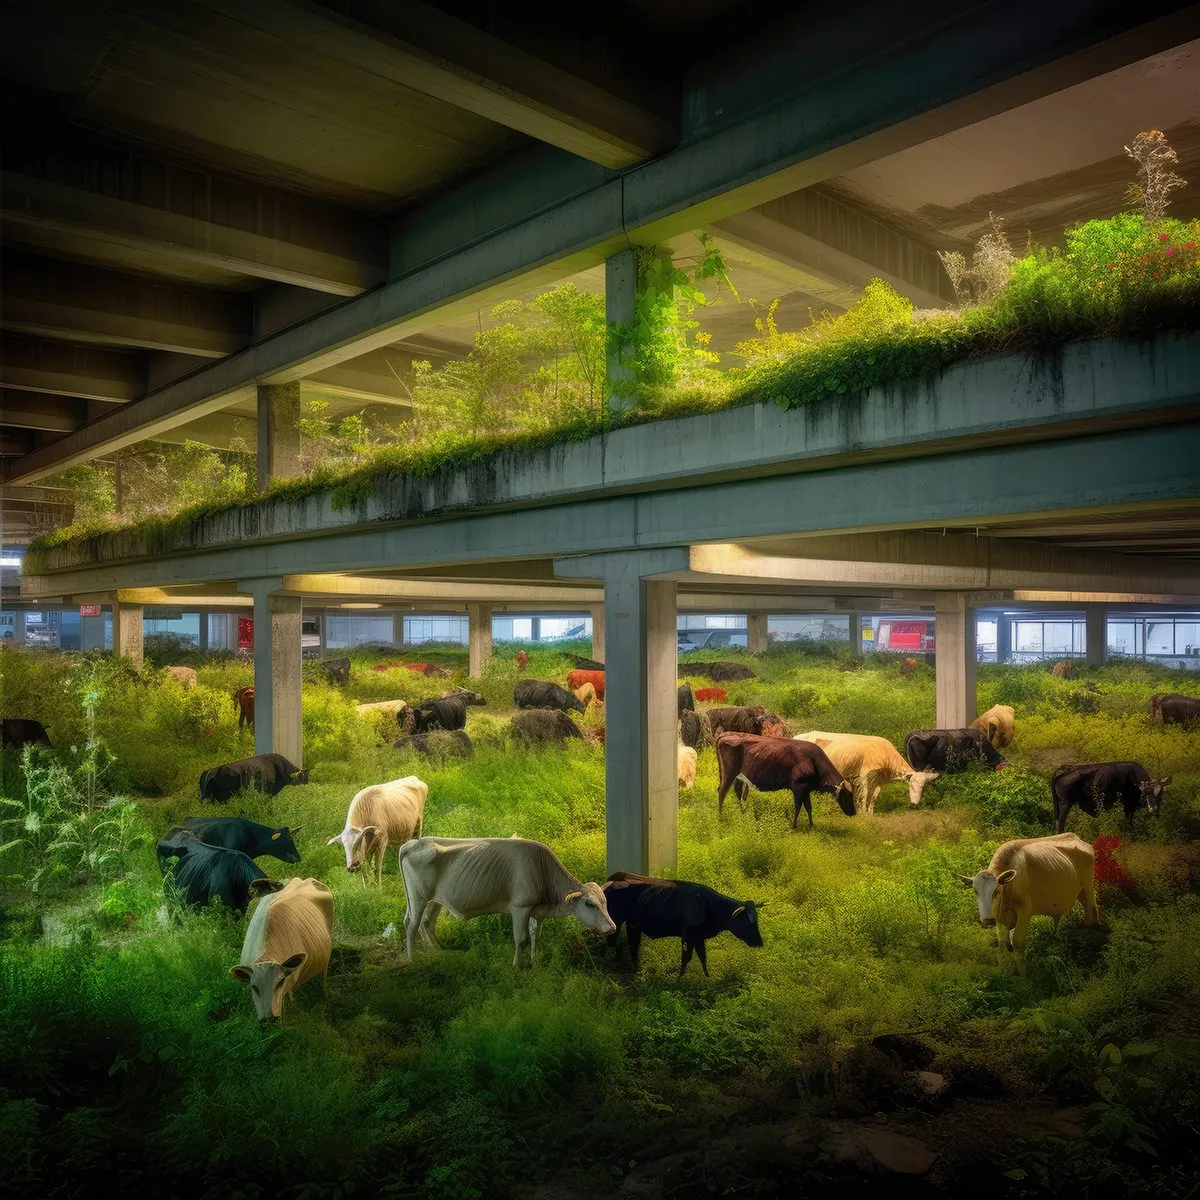
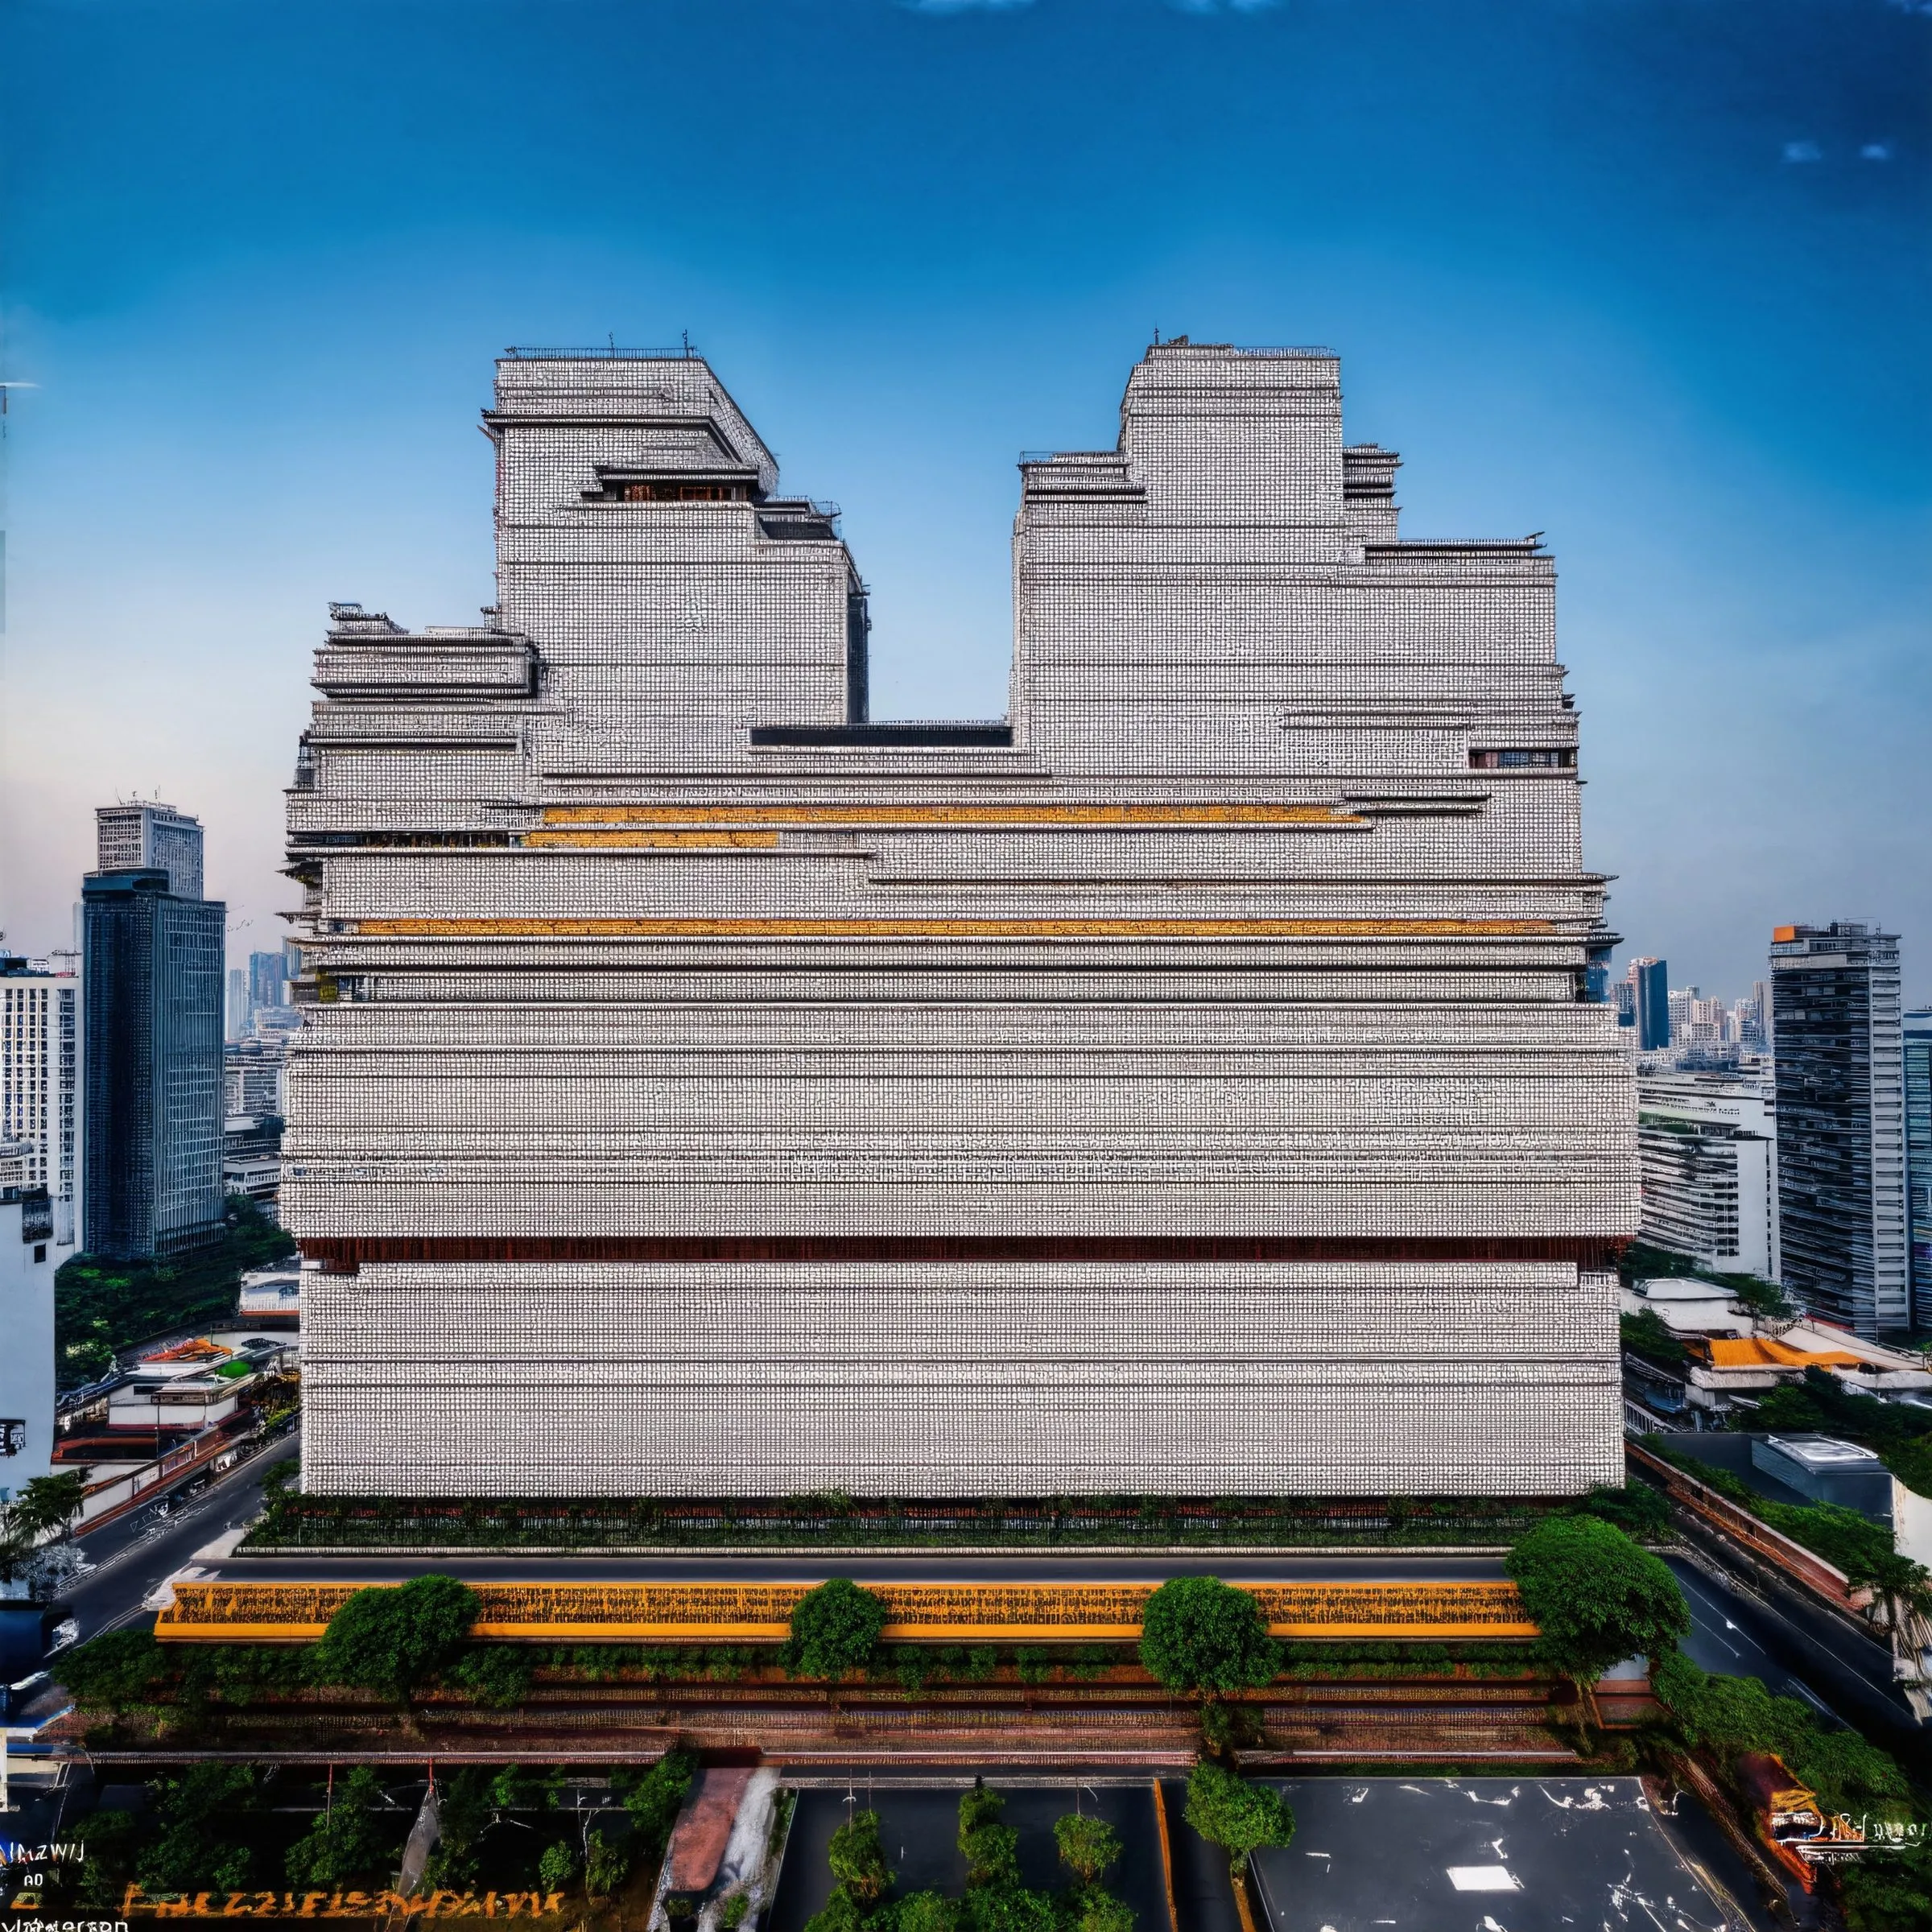
What do image models believe about the world’s cities? LCA-GCS measures it. One prompt grammar, type in city, was run for some eighty architectural types across 5,856 cities and four generations of diffusion models, producing 1,060,166 images that can be compared type by type, city by city, and model by model. Every city with a population above 100,000 is represented by more than 200 samples of its architectural types, from details to interiors to urban forms, held in a flat ontology in which they can be searched and compared in ways uncommon for existing databases.
The set is an instrument rather than a picture archive: it makes the models’ compressions visible. Where a city is well represented in the training data, its types differentiate; where it is not, the model regresses to a statistical mean that looks plausible and is culturally particular. The published analysis scores every image against its prompt, maps that confidence by country, and ranks the set by visual complexity, so that the stereotypes become measurable rather than anecdotal.
The pilot was Synthetic Data Types, begun in 2023 with Zidong Liu: a synthetic dataset of 450,000 images, segmented into individual building segments and analyzed statistically for compositional features across 5,600 cities. It asked, first, whether large text-to-image models can portray a wide array of local types realistically and where they fail; second, how cities compare compositionally once the data are categorized, which yielded the key metrics for this kind of big-data analysis; and third, how a derived compositional score relates to established socio-economic city rankings. The findings: despite the biases and limitations of the data, a synthetic database gives a deeper analytical basis than traditional methods, and the generated set alone paints forensic landscapes of locales that are not typically showcased, Makoko, Dharavi, Kibera, and Timbuktu among them. Attributes such as quality of life turned out to be tied to neighborhoods and projects rather than to entire cities, which is why architectural typologies work best at a human-oriented scale, where the city interfaces with architecture. With the term data-centric typologies we set out to challenge traditional classification systems while reviving type as a strategy that links socio-economic contexts to the physical form of a place, a building, or a city; the study was presented at ACADIA 2023 in Denver.
The dataset is released on Hugging Face under CC BY-NC 4.0, with a landing site at largecityarchitecture.org for the maps and the CLIP-score analysis. It is the ground on which the later atlases stand: Latent Earth turns the same question toward places, the chapter Generating Latent Worlds (Springer, 2025) maps regional differences of types within image models, and Compositional Intelligence develops what the compressions mean for architectural typology.
Gallery
20 plates · click to enlarge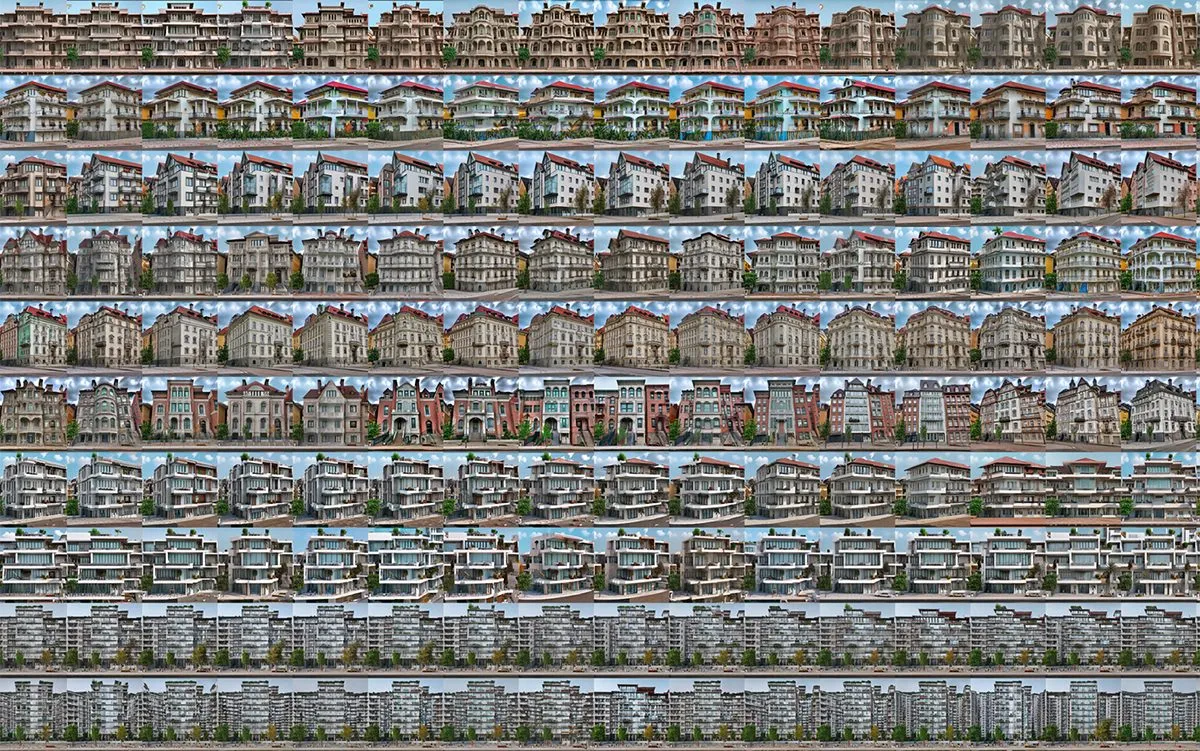
One type, one city, many samples: the regression to a mean · SDXL 1.0 · 2024 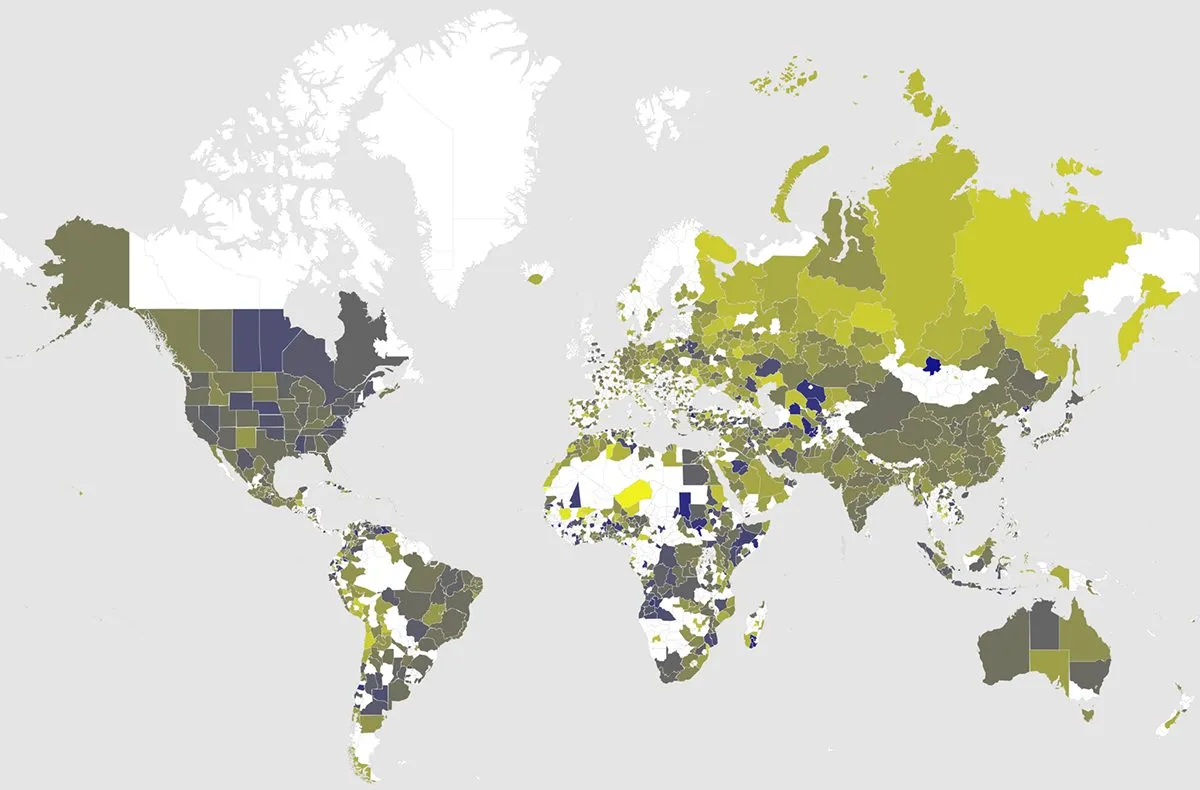
CLIP-score by country: where the model is confident, and where it guesses · 2024 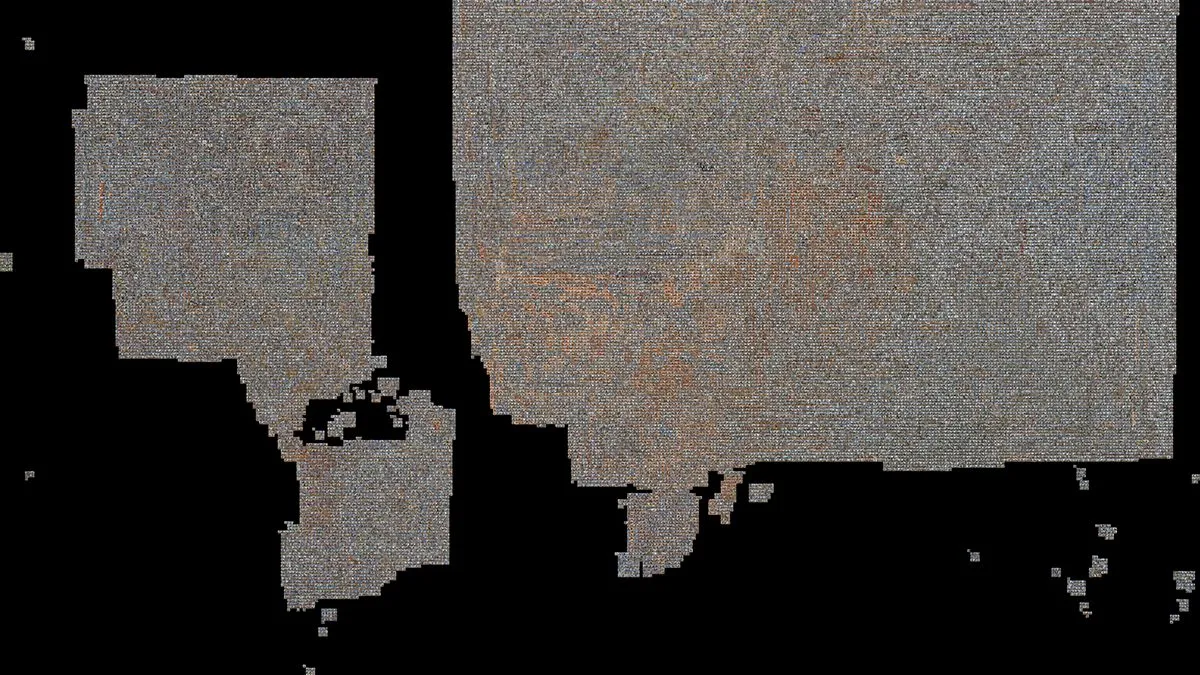
The set sorted by embedding · 2024 
Contact sheet of the set · 2024 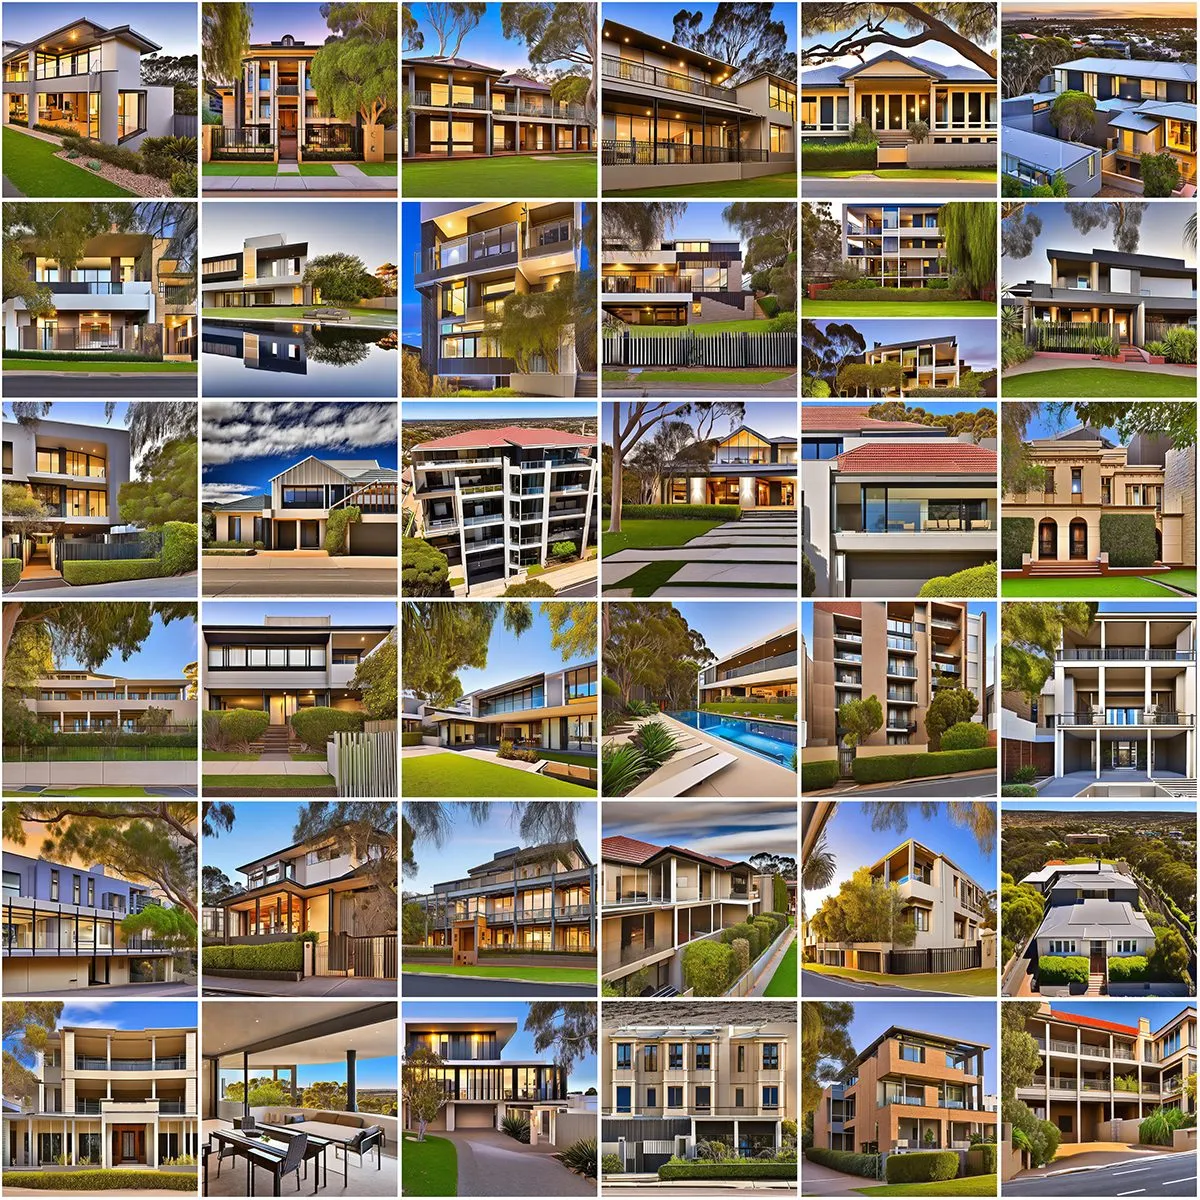
Adelaide · Synthetic Data Types, study toward the set · 2023 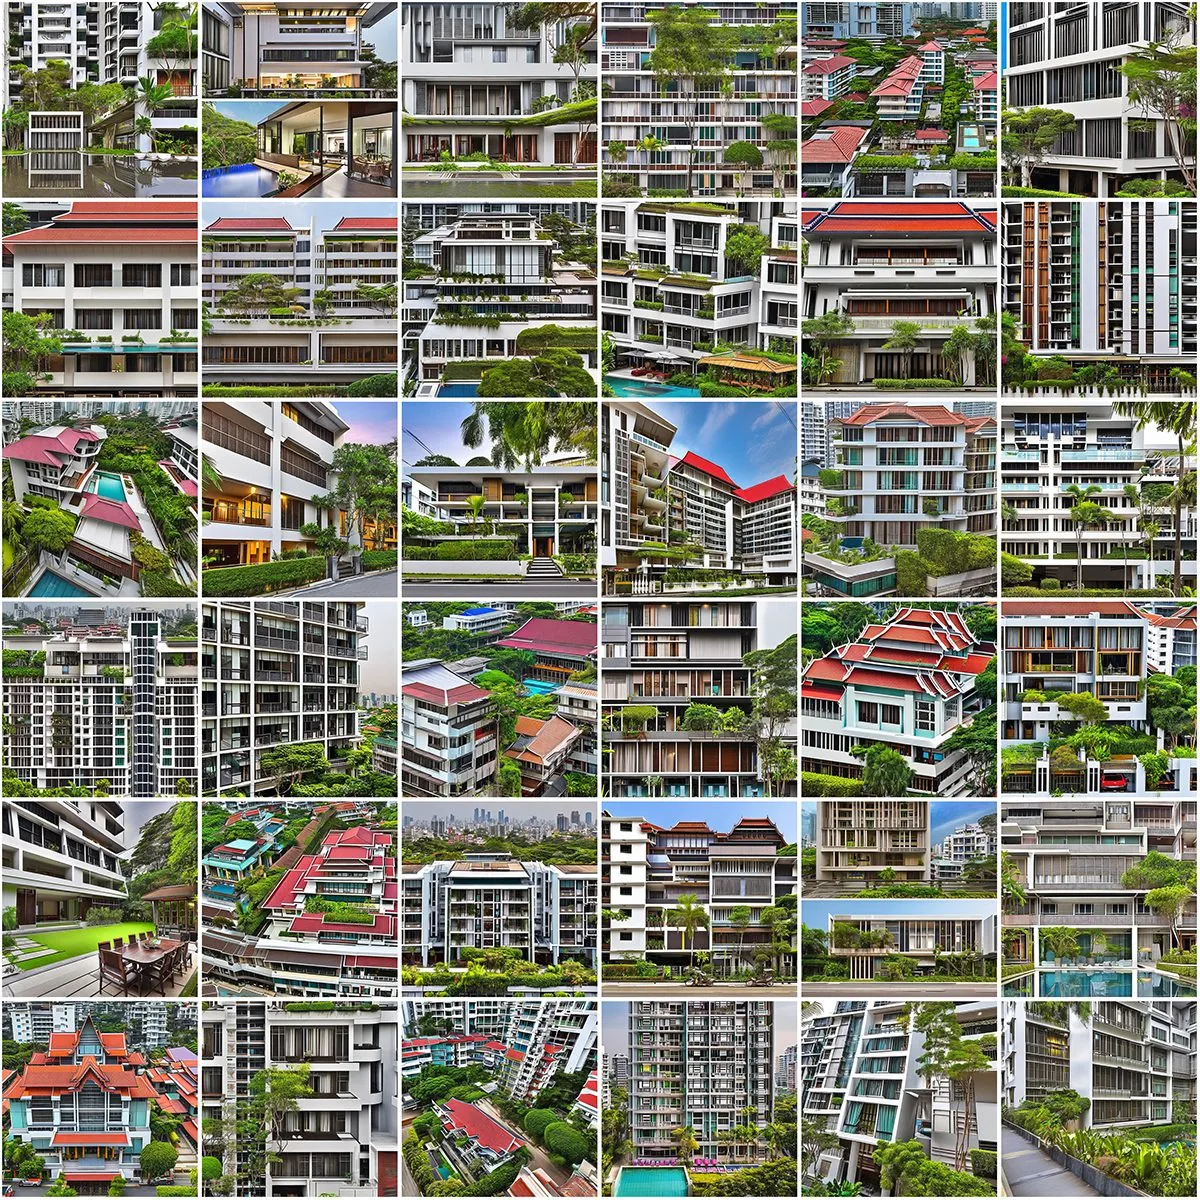
Bangkok · Synthetic Data Types · 2023 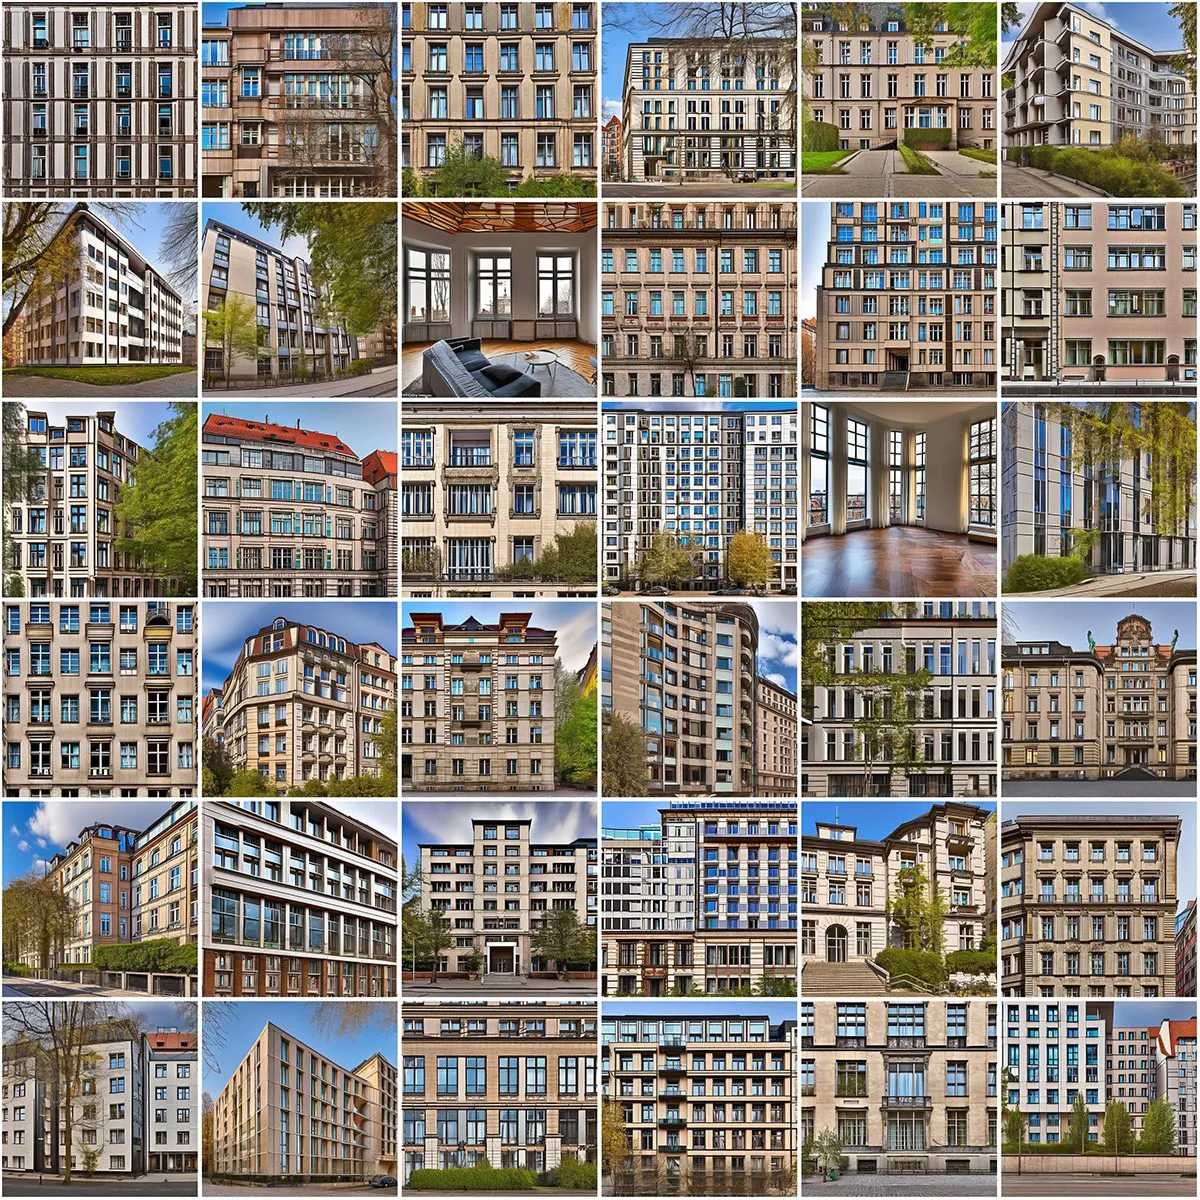
Berlin · Synthetic Data Types · 2023 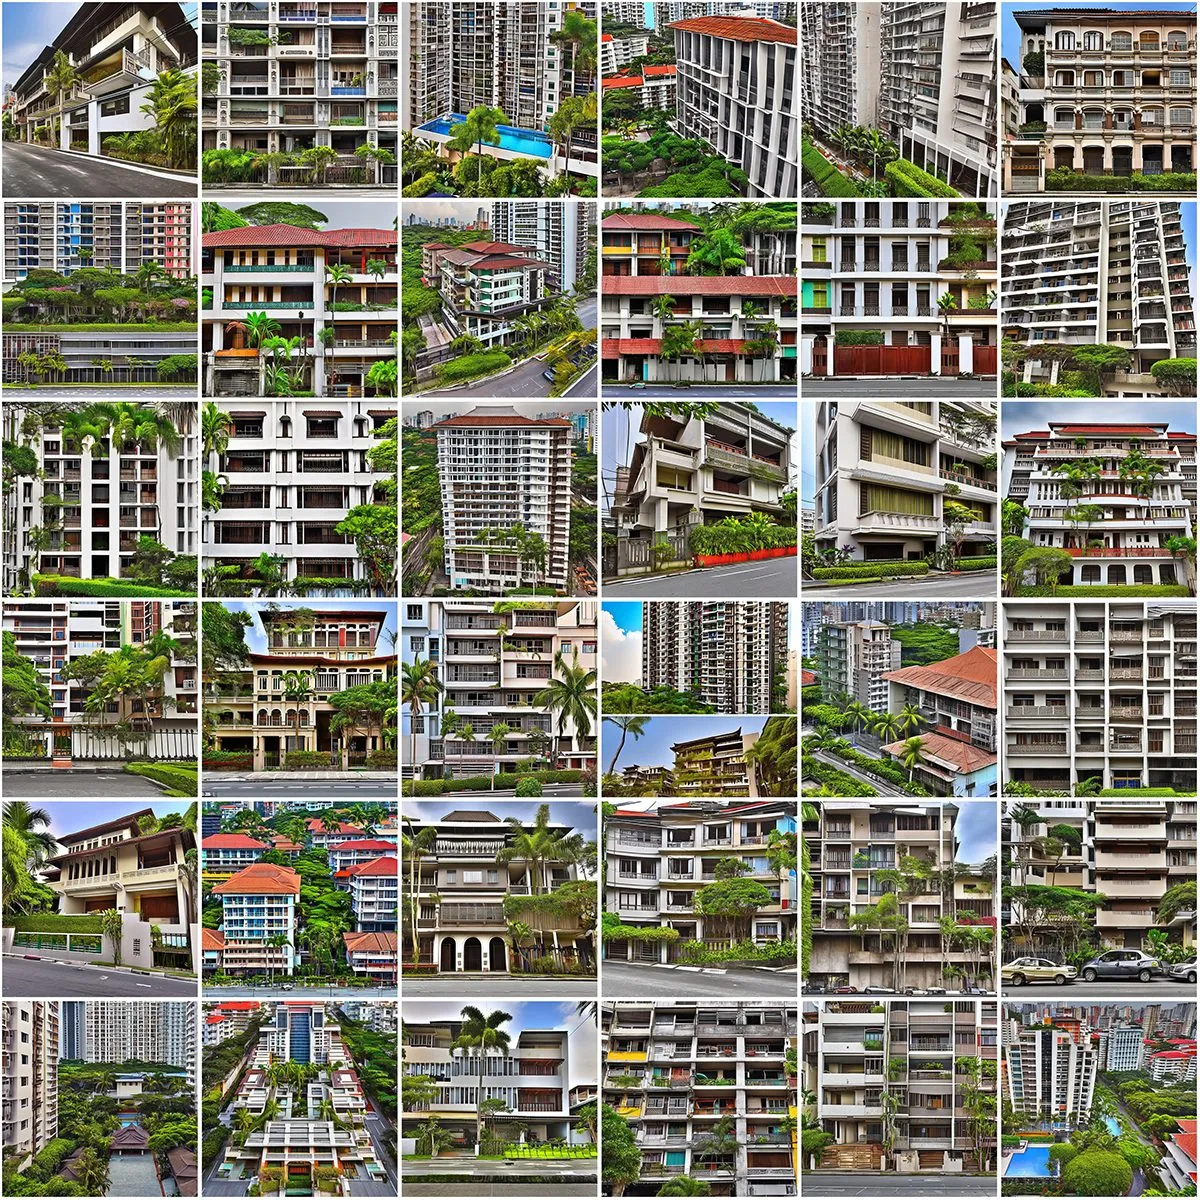
Manila · Synthetic Data Types · 2023 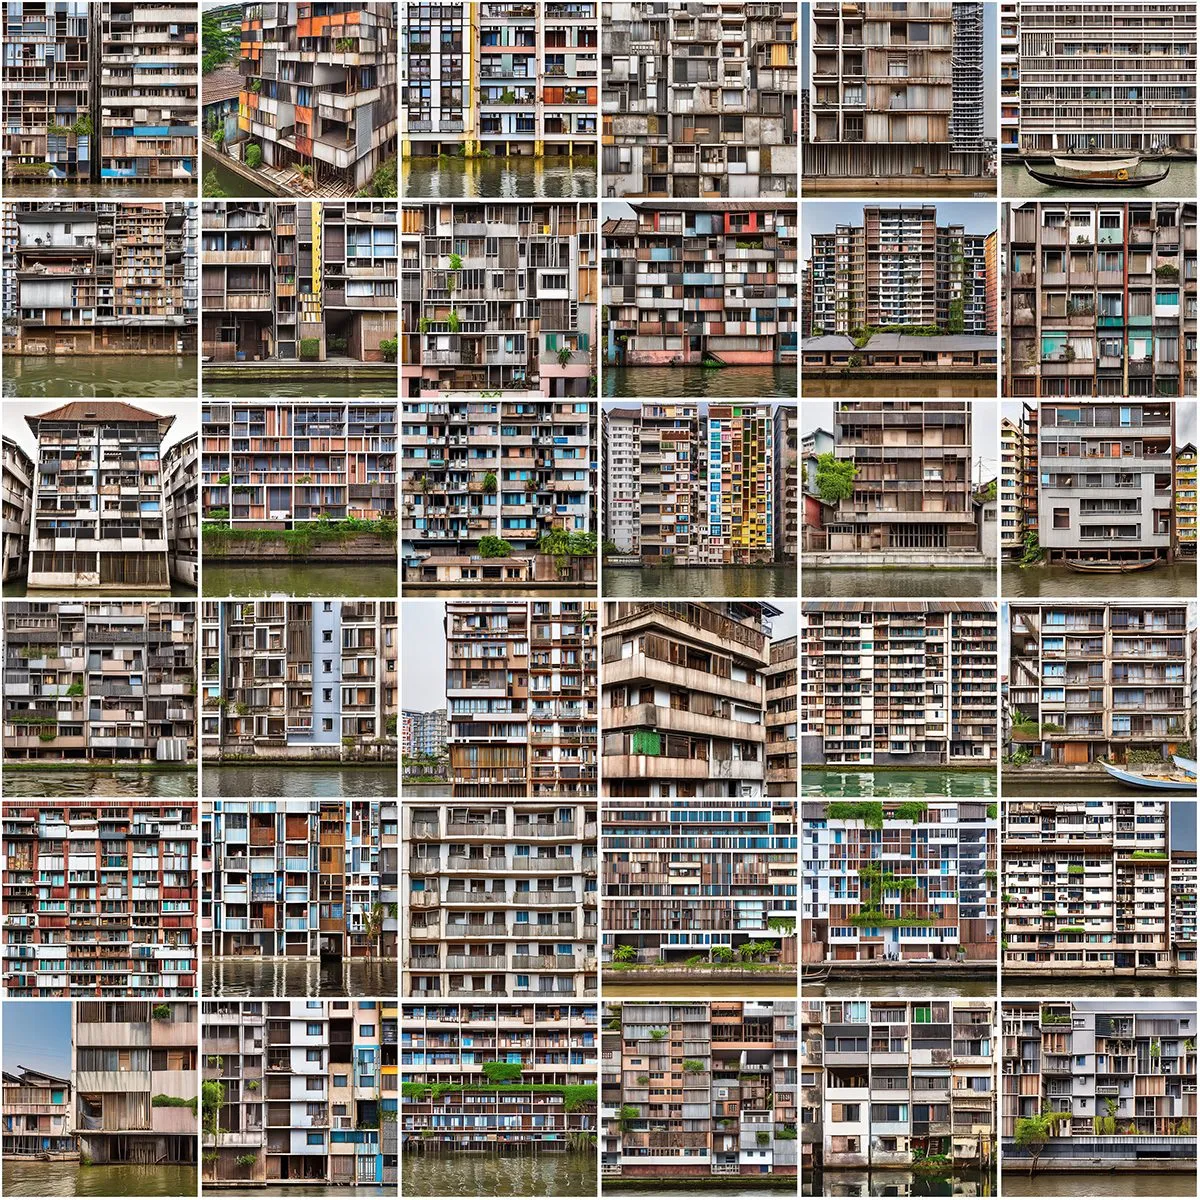
Makoko: a locale the training data rarely showcases · Synthetic Data Types · 2023 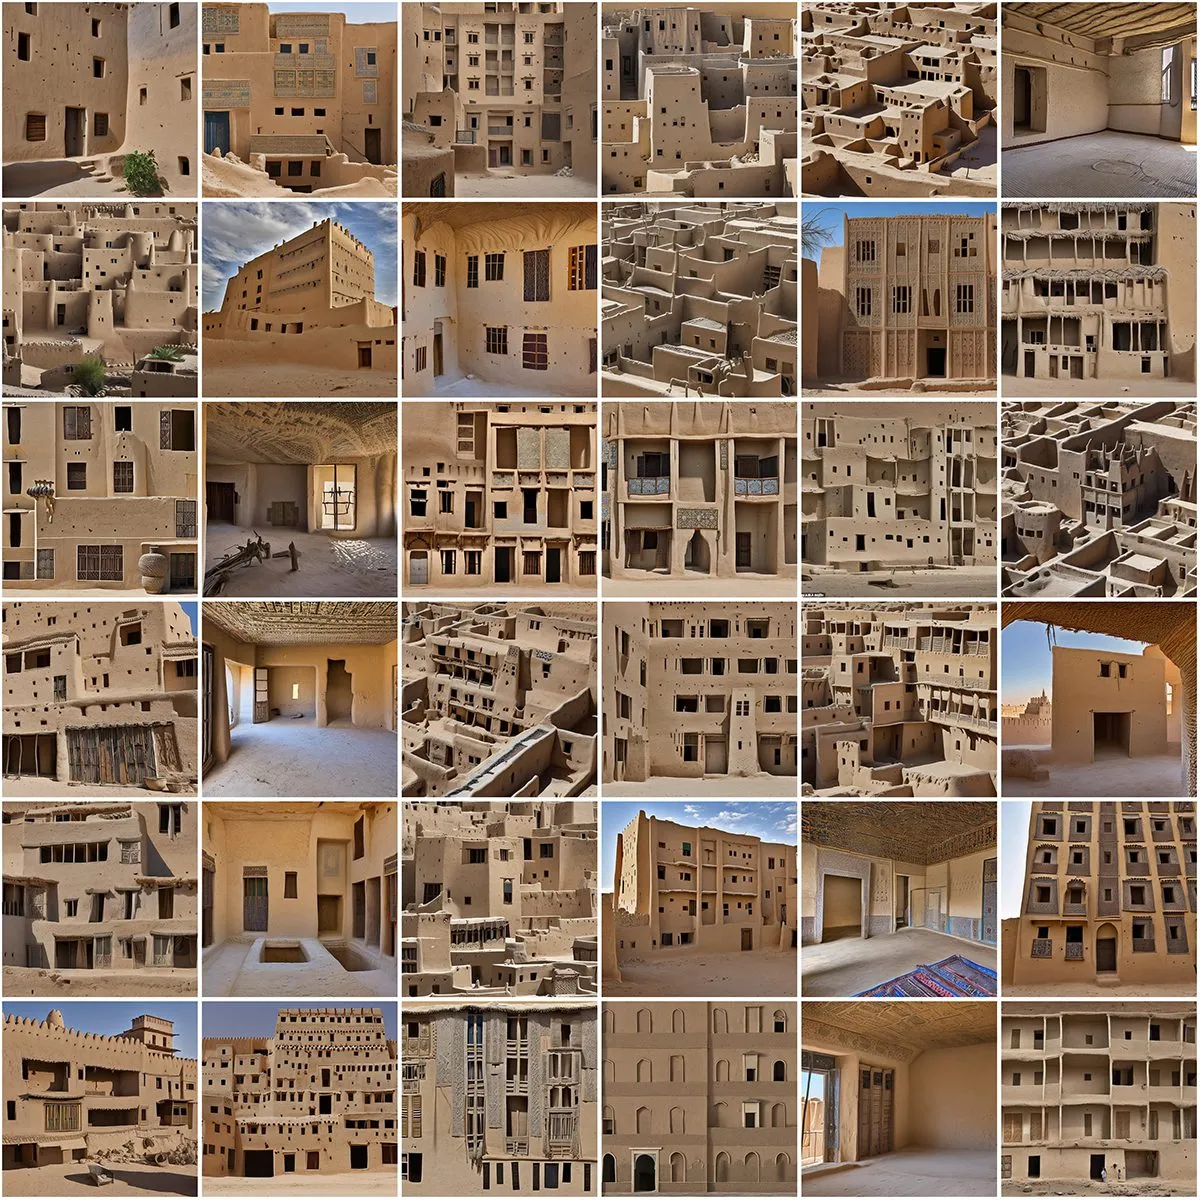
Timbuktu · Synthetic Data Types · 2023 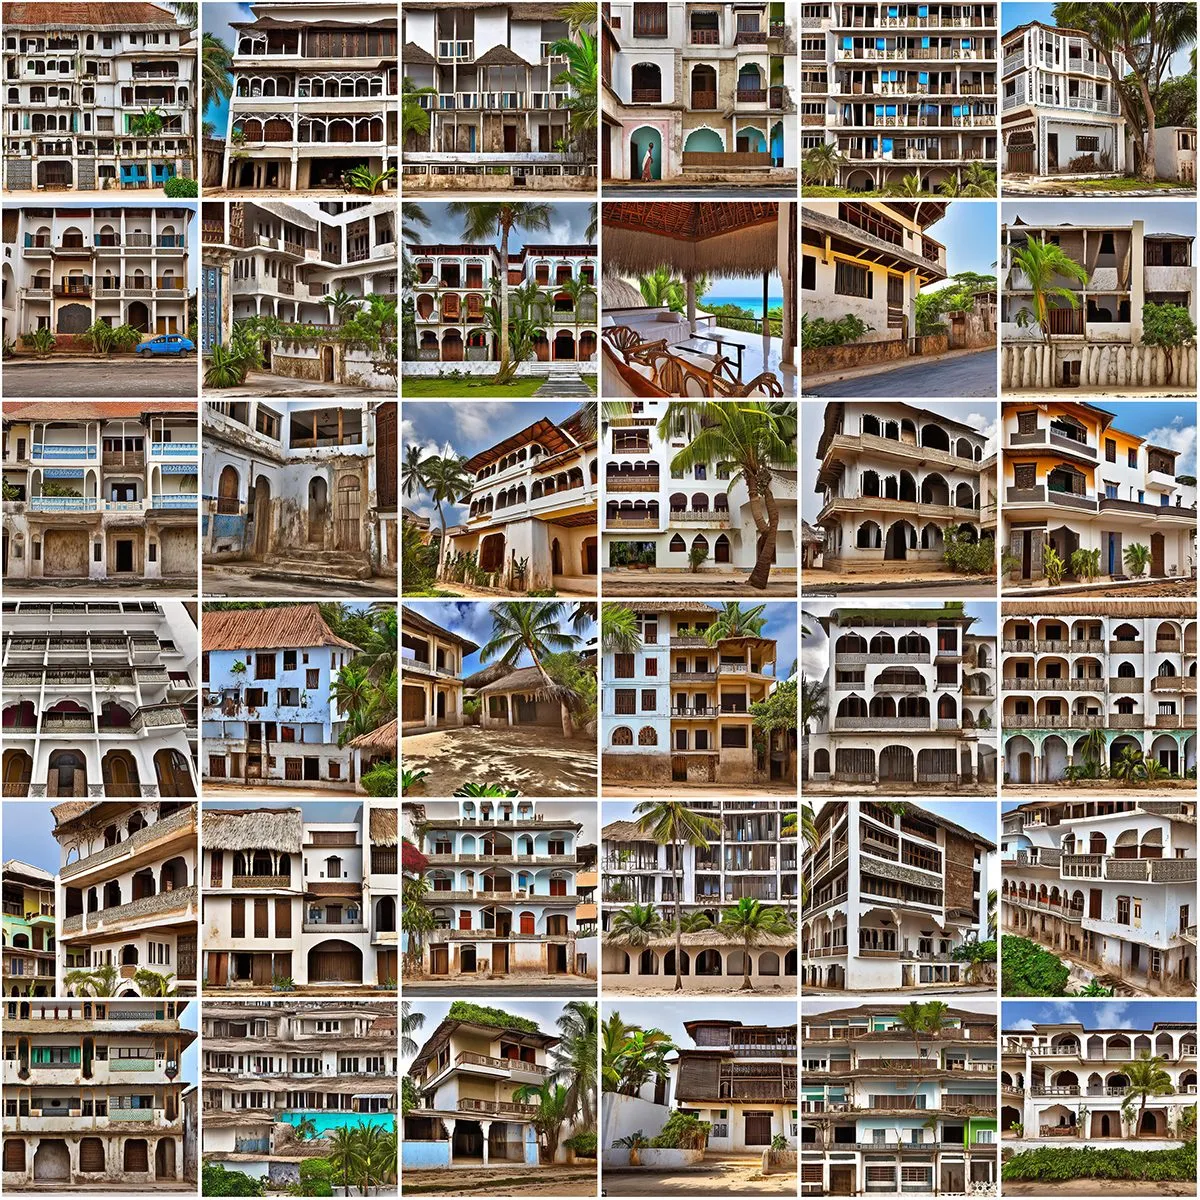
Zanzibar · Synthetic Data Types · 2023 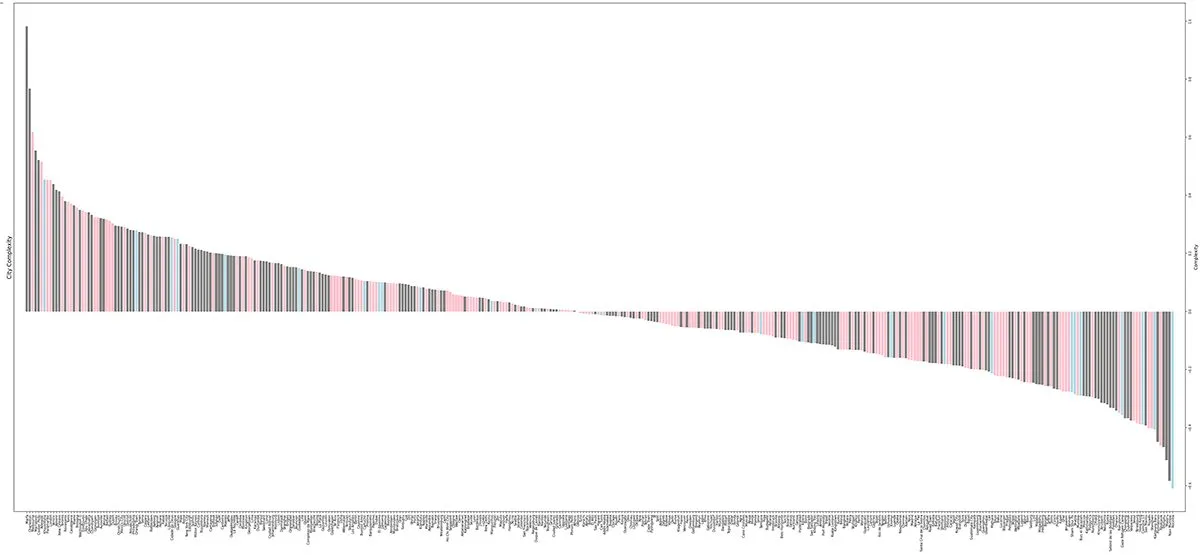
Complexity gram: the set ranked by visual complexity · 2023 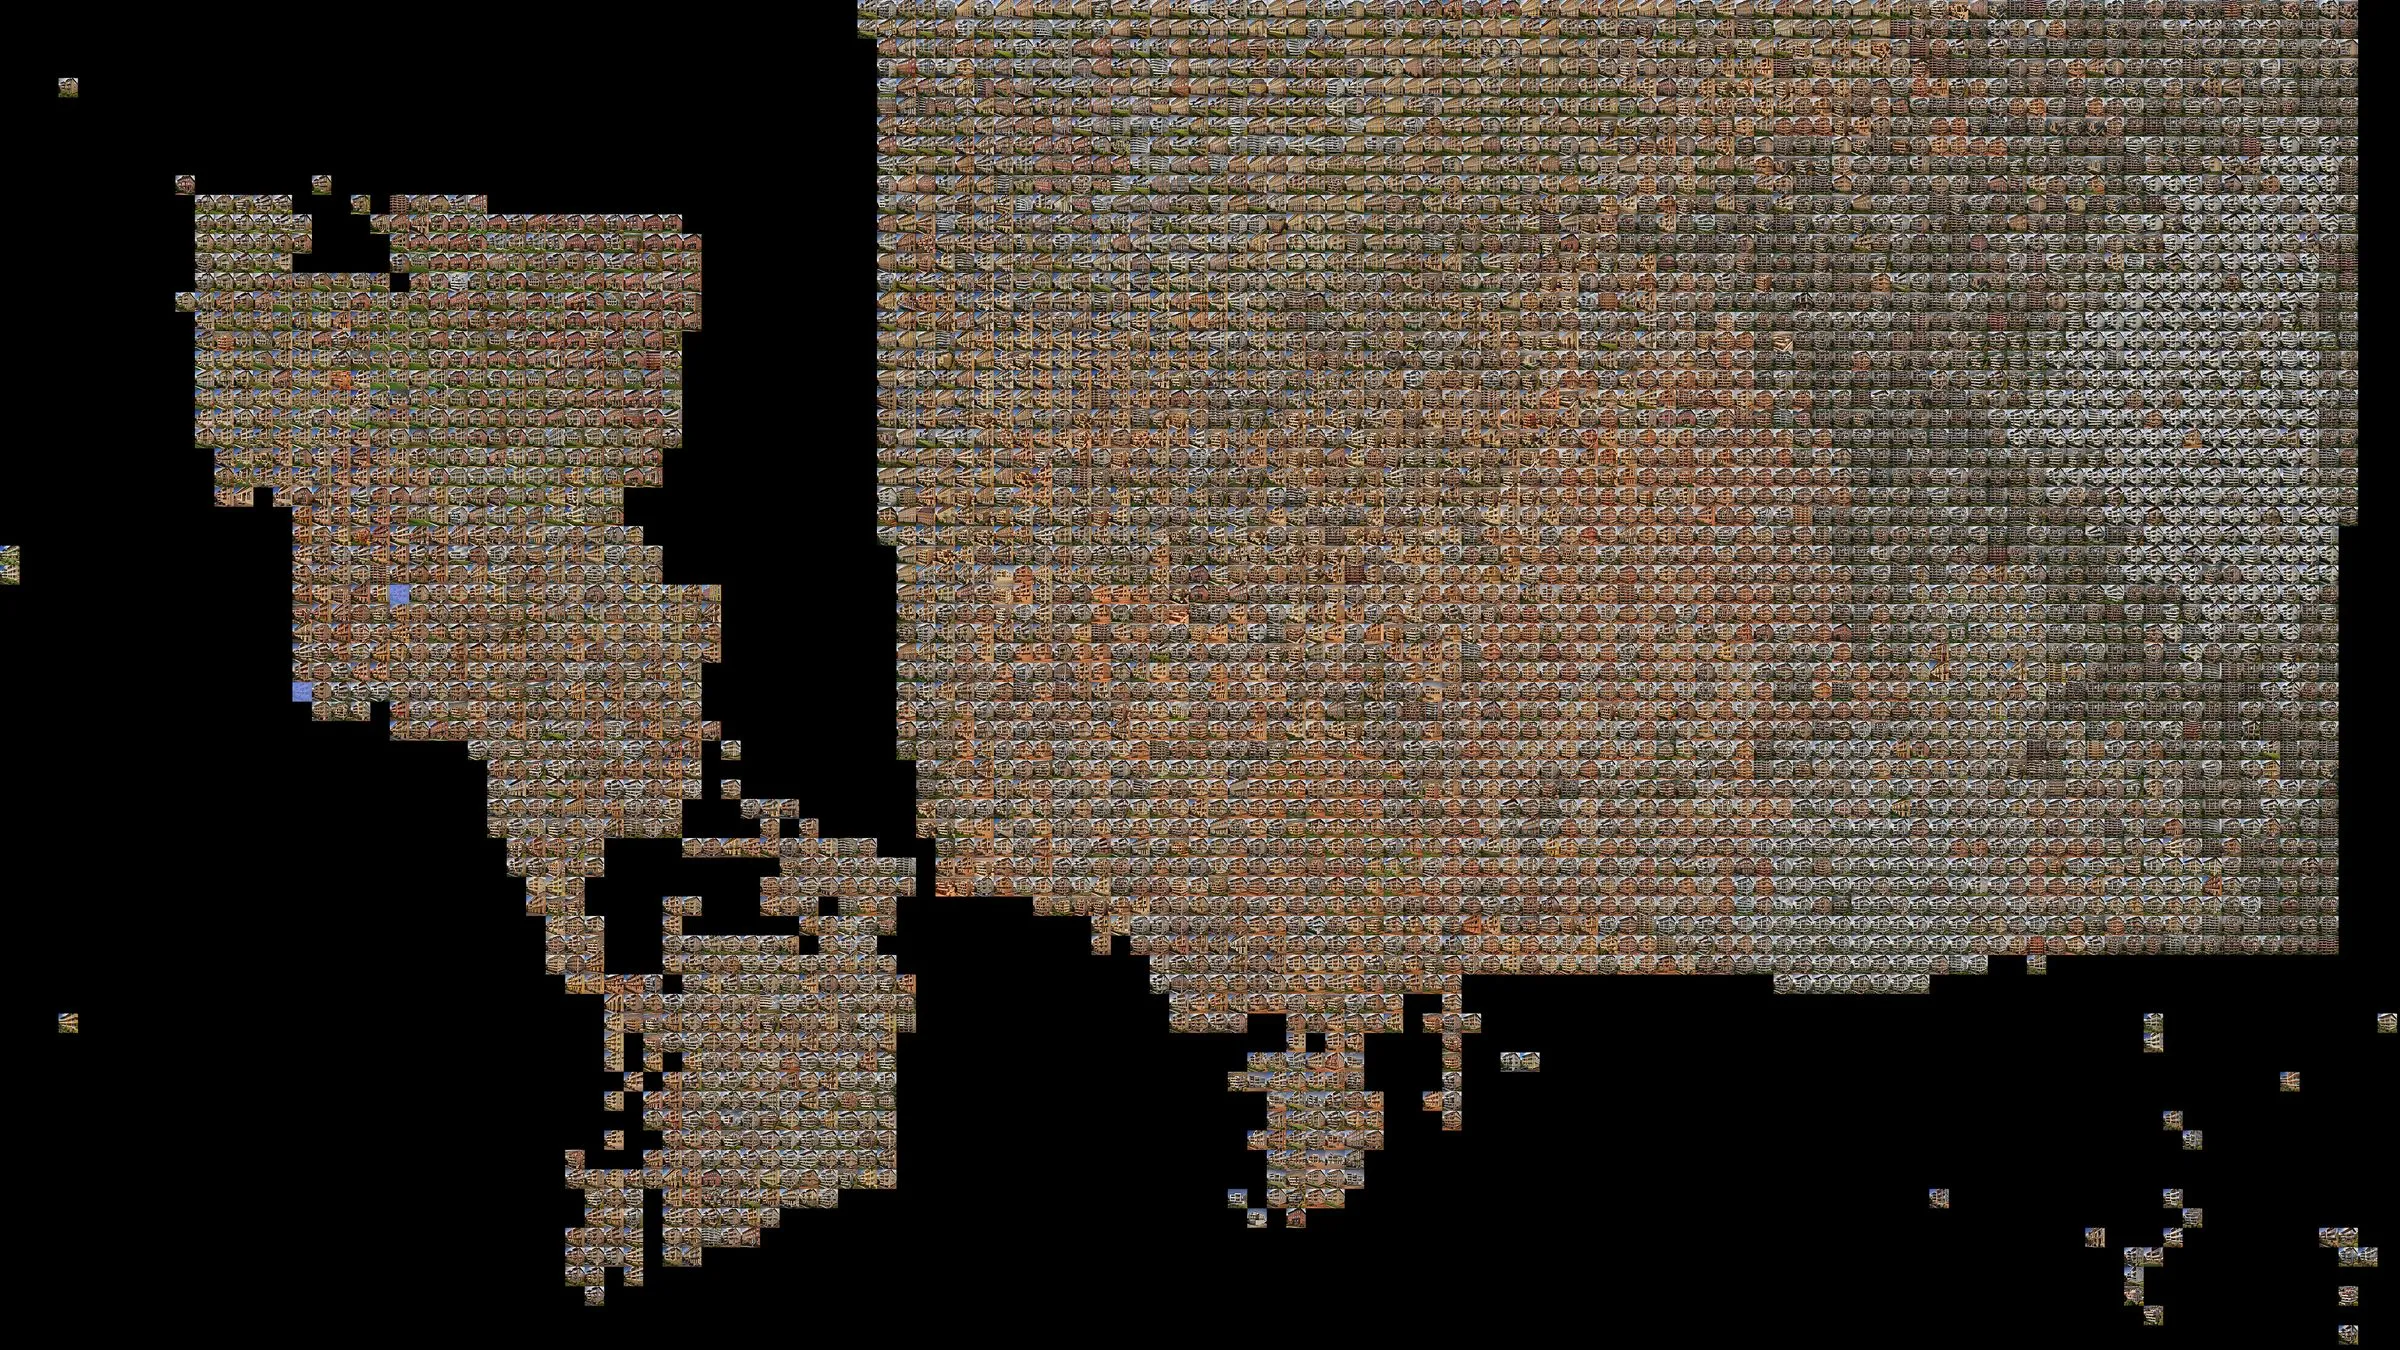
One type adapted per city, seed 3746759409 · generated images · 2024 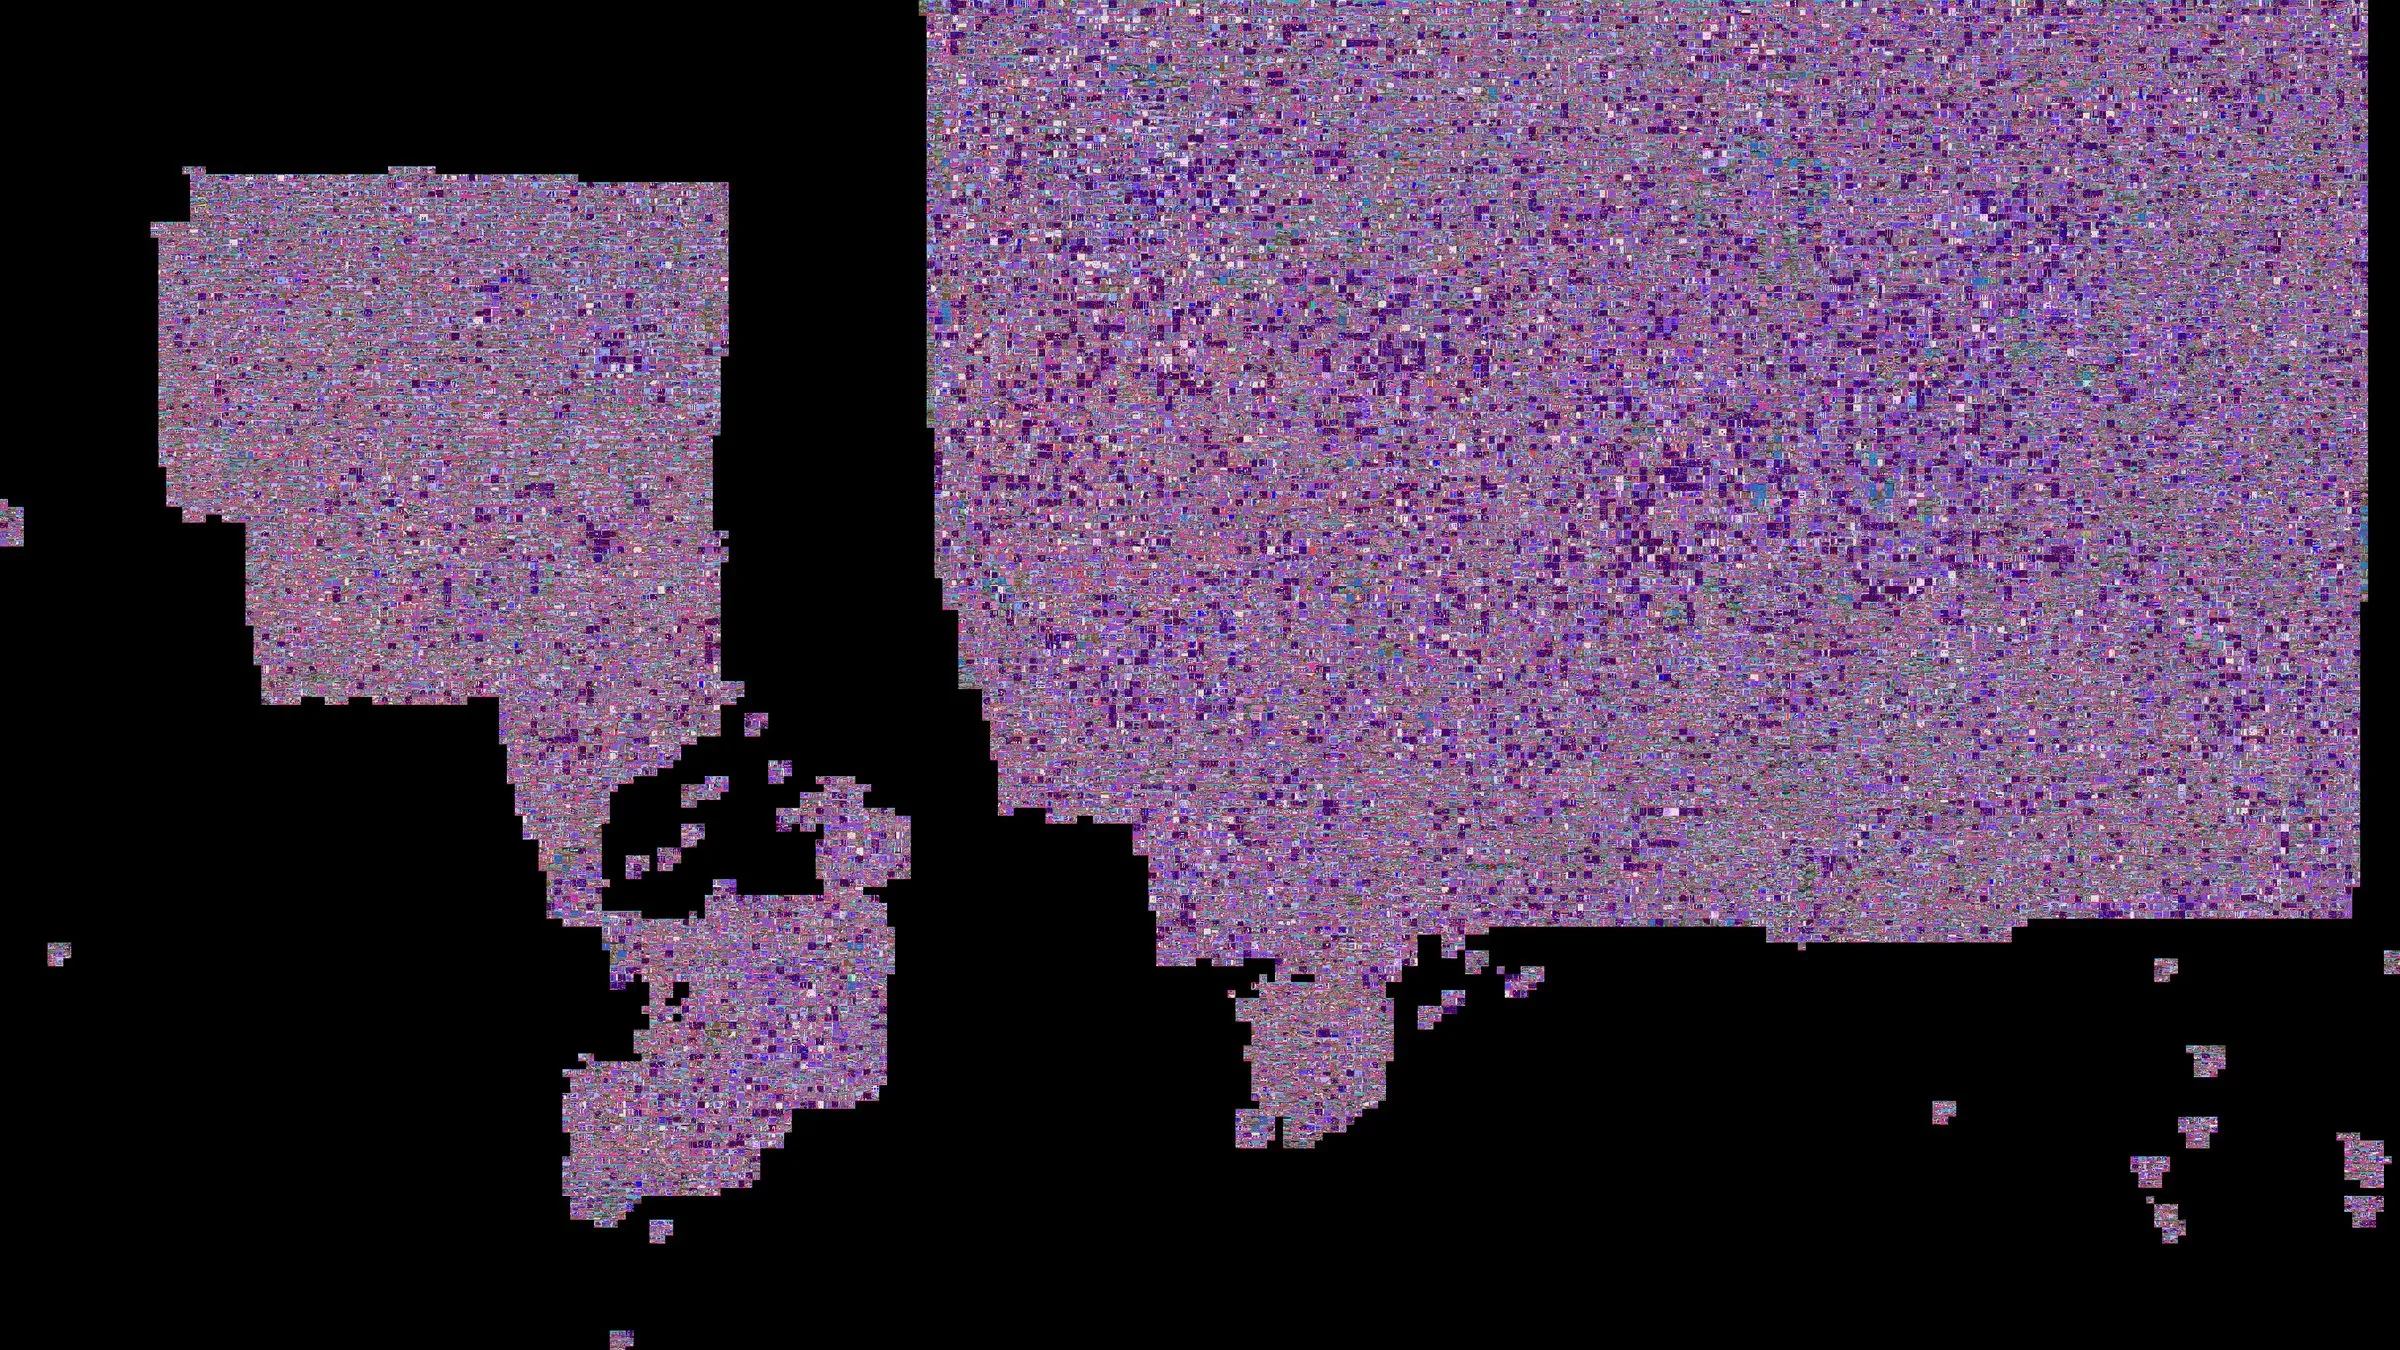
Embodied carbon map · SDXL and SAM · 2024 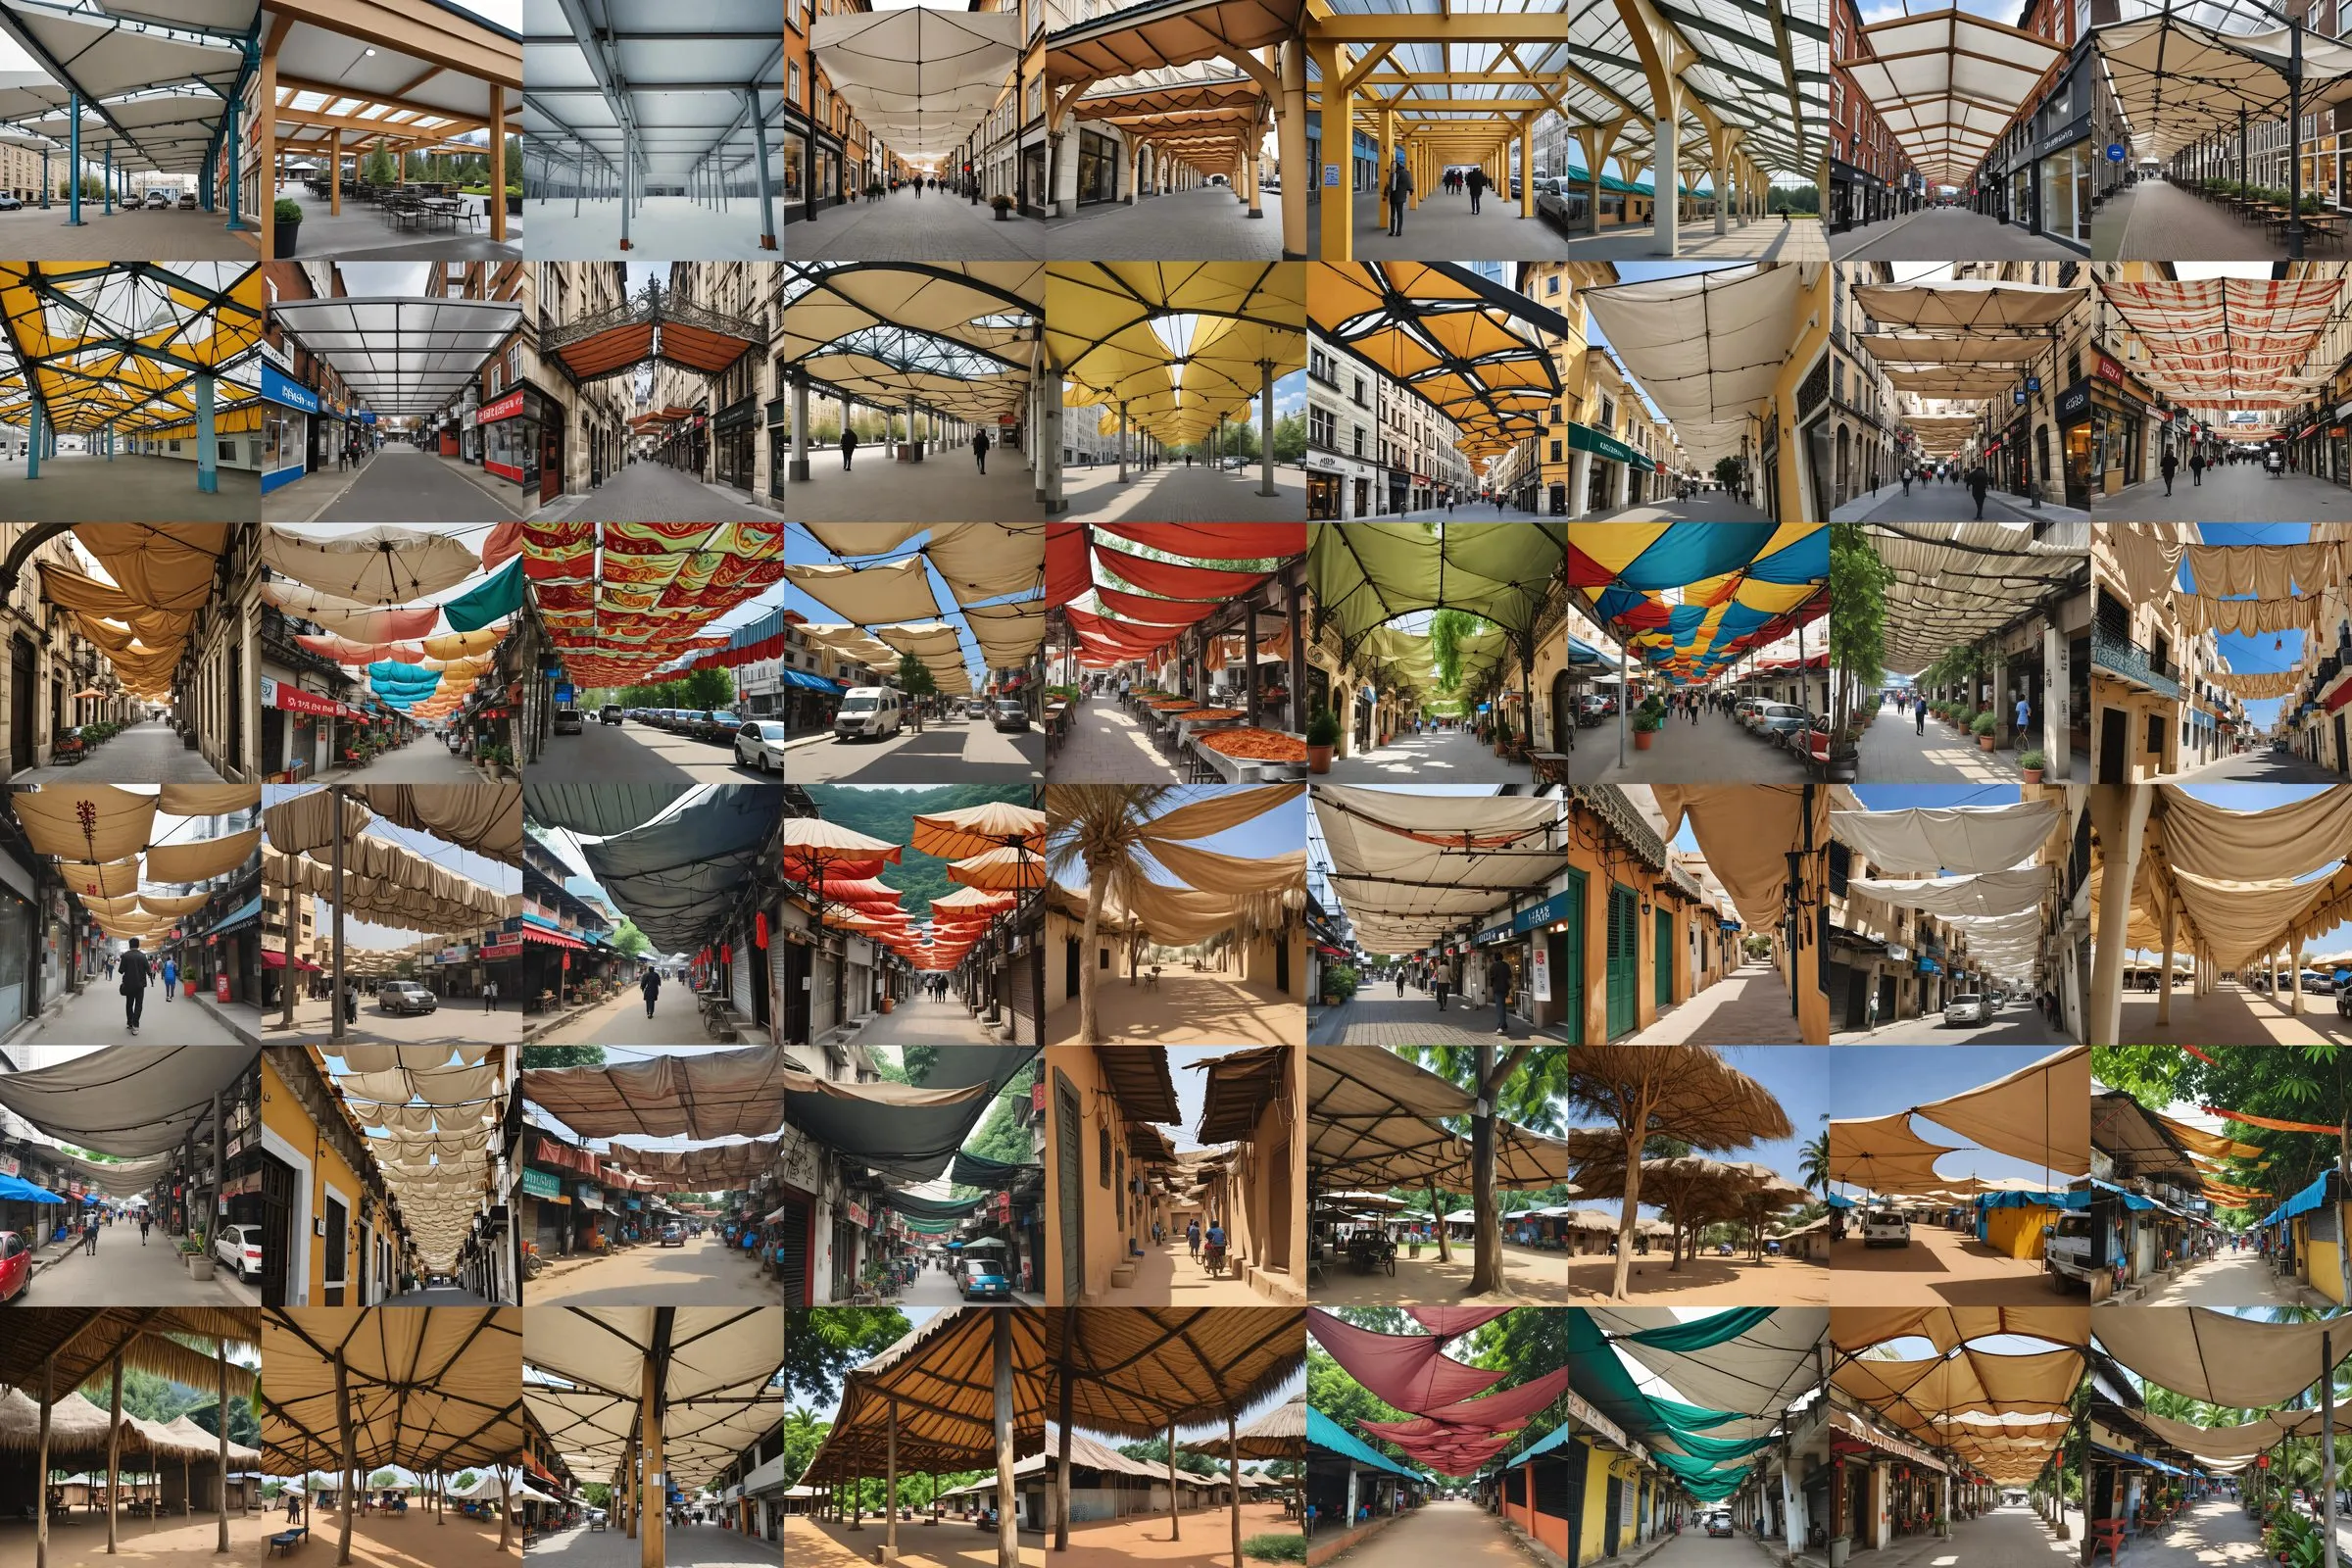
Canopies from north to south · generated images · 2024 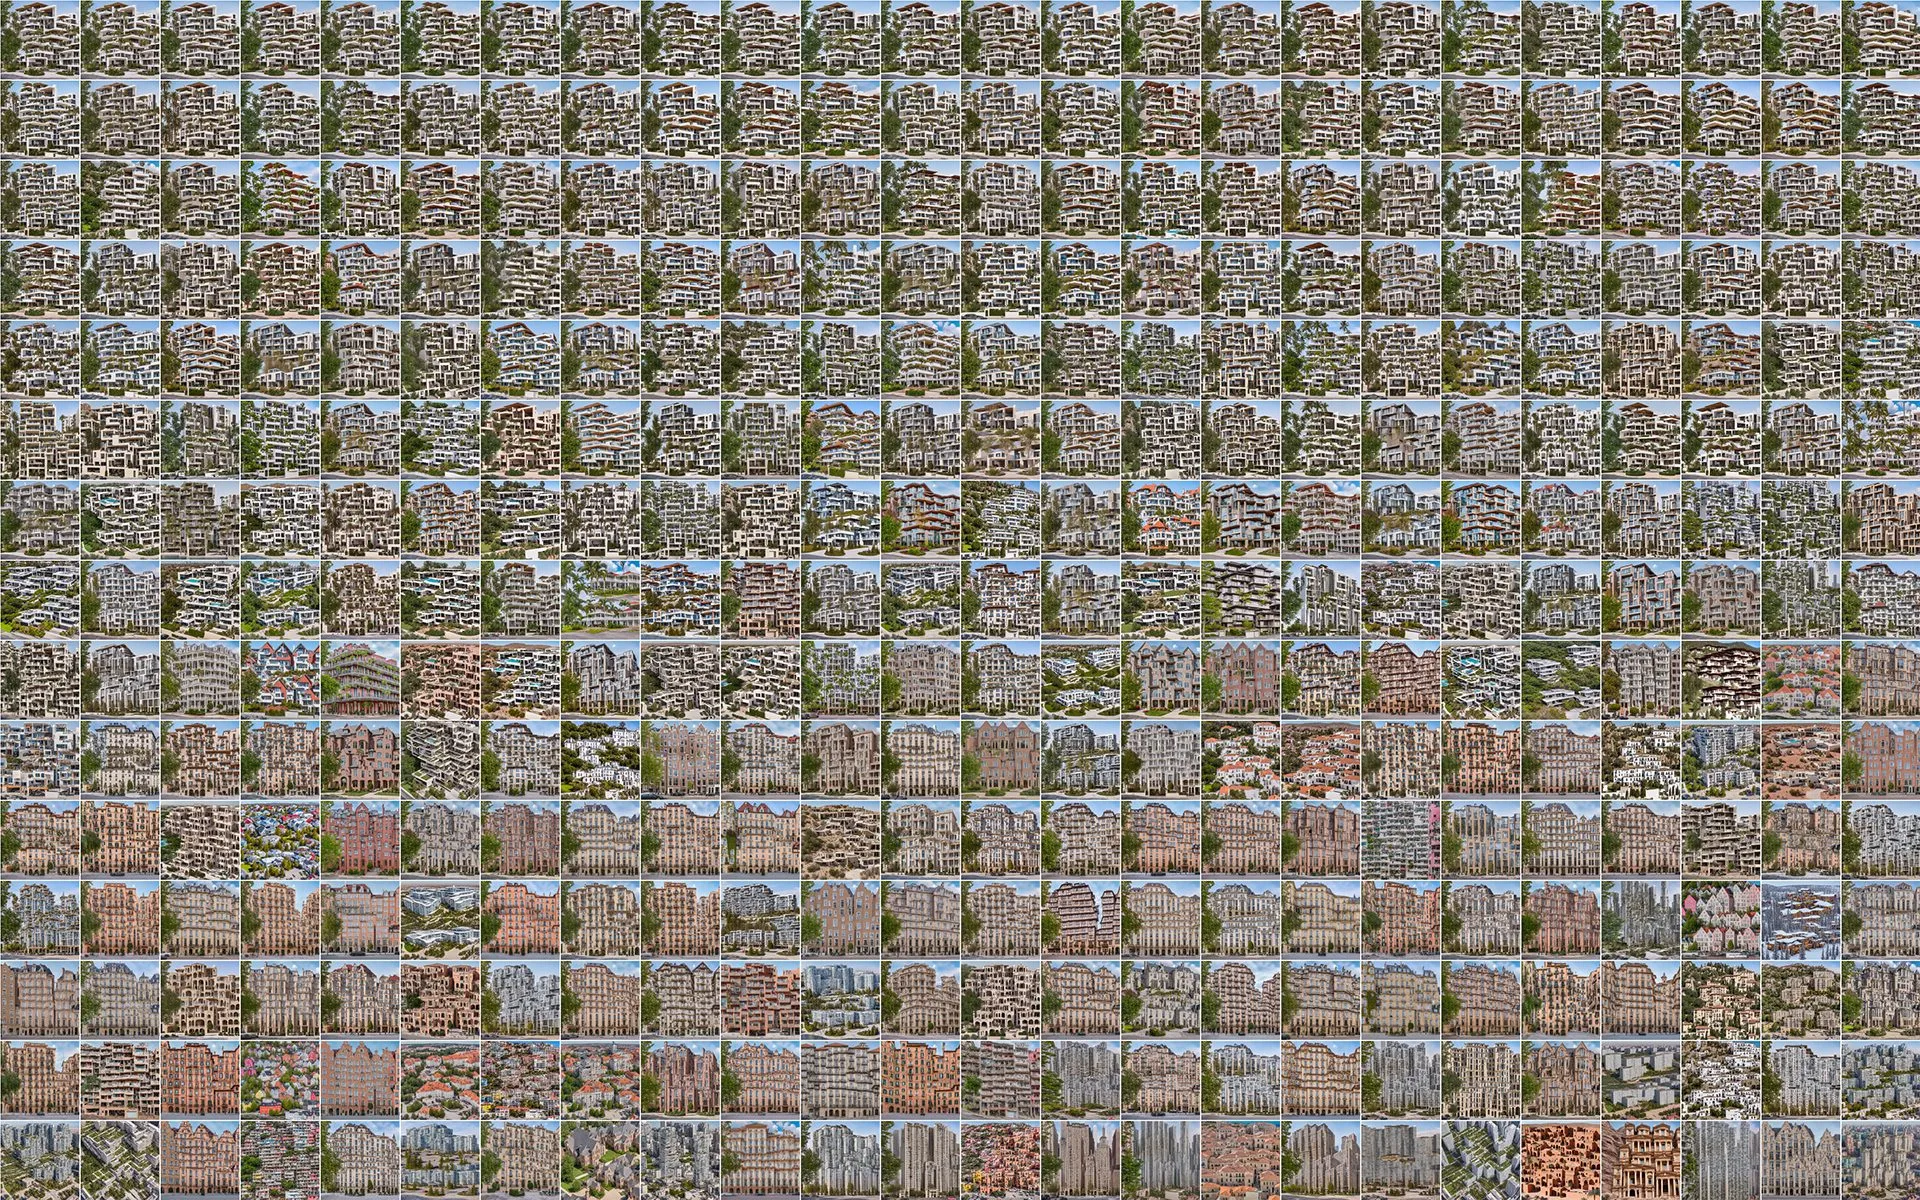
CLIP alignment contact sheet · generated images · 2024 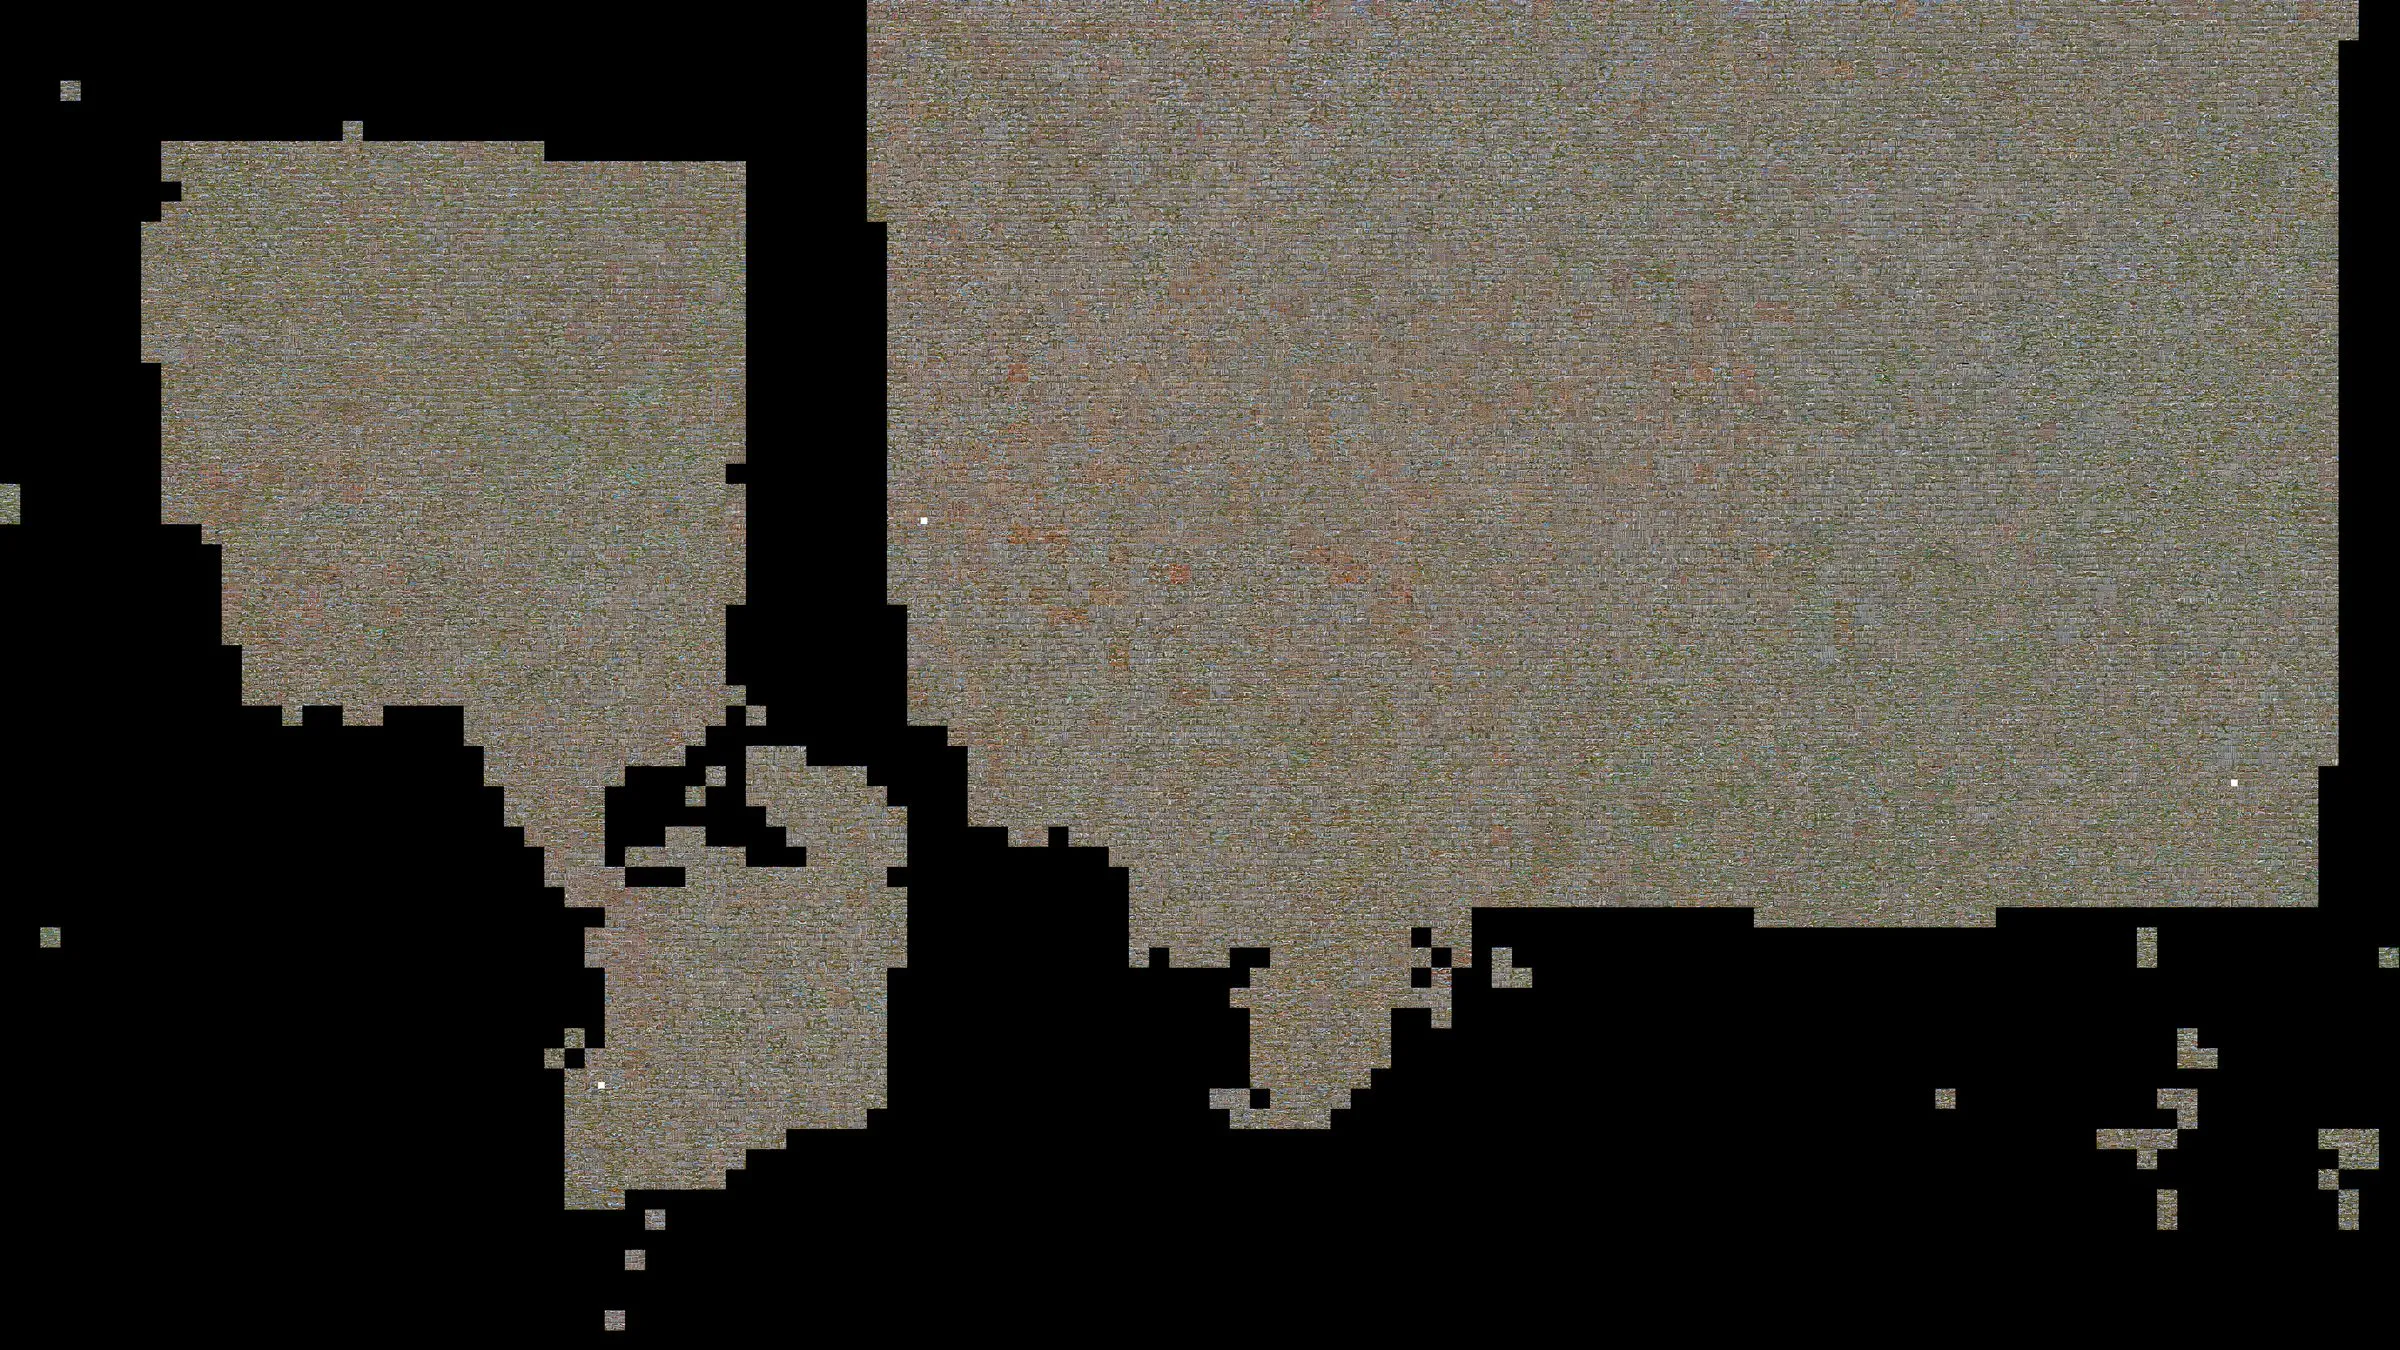
Lca map building sd2 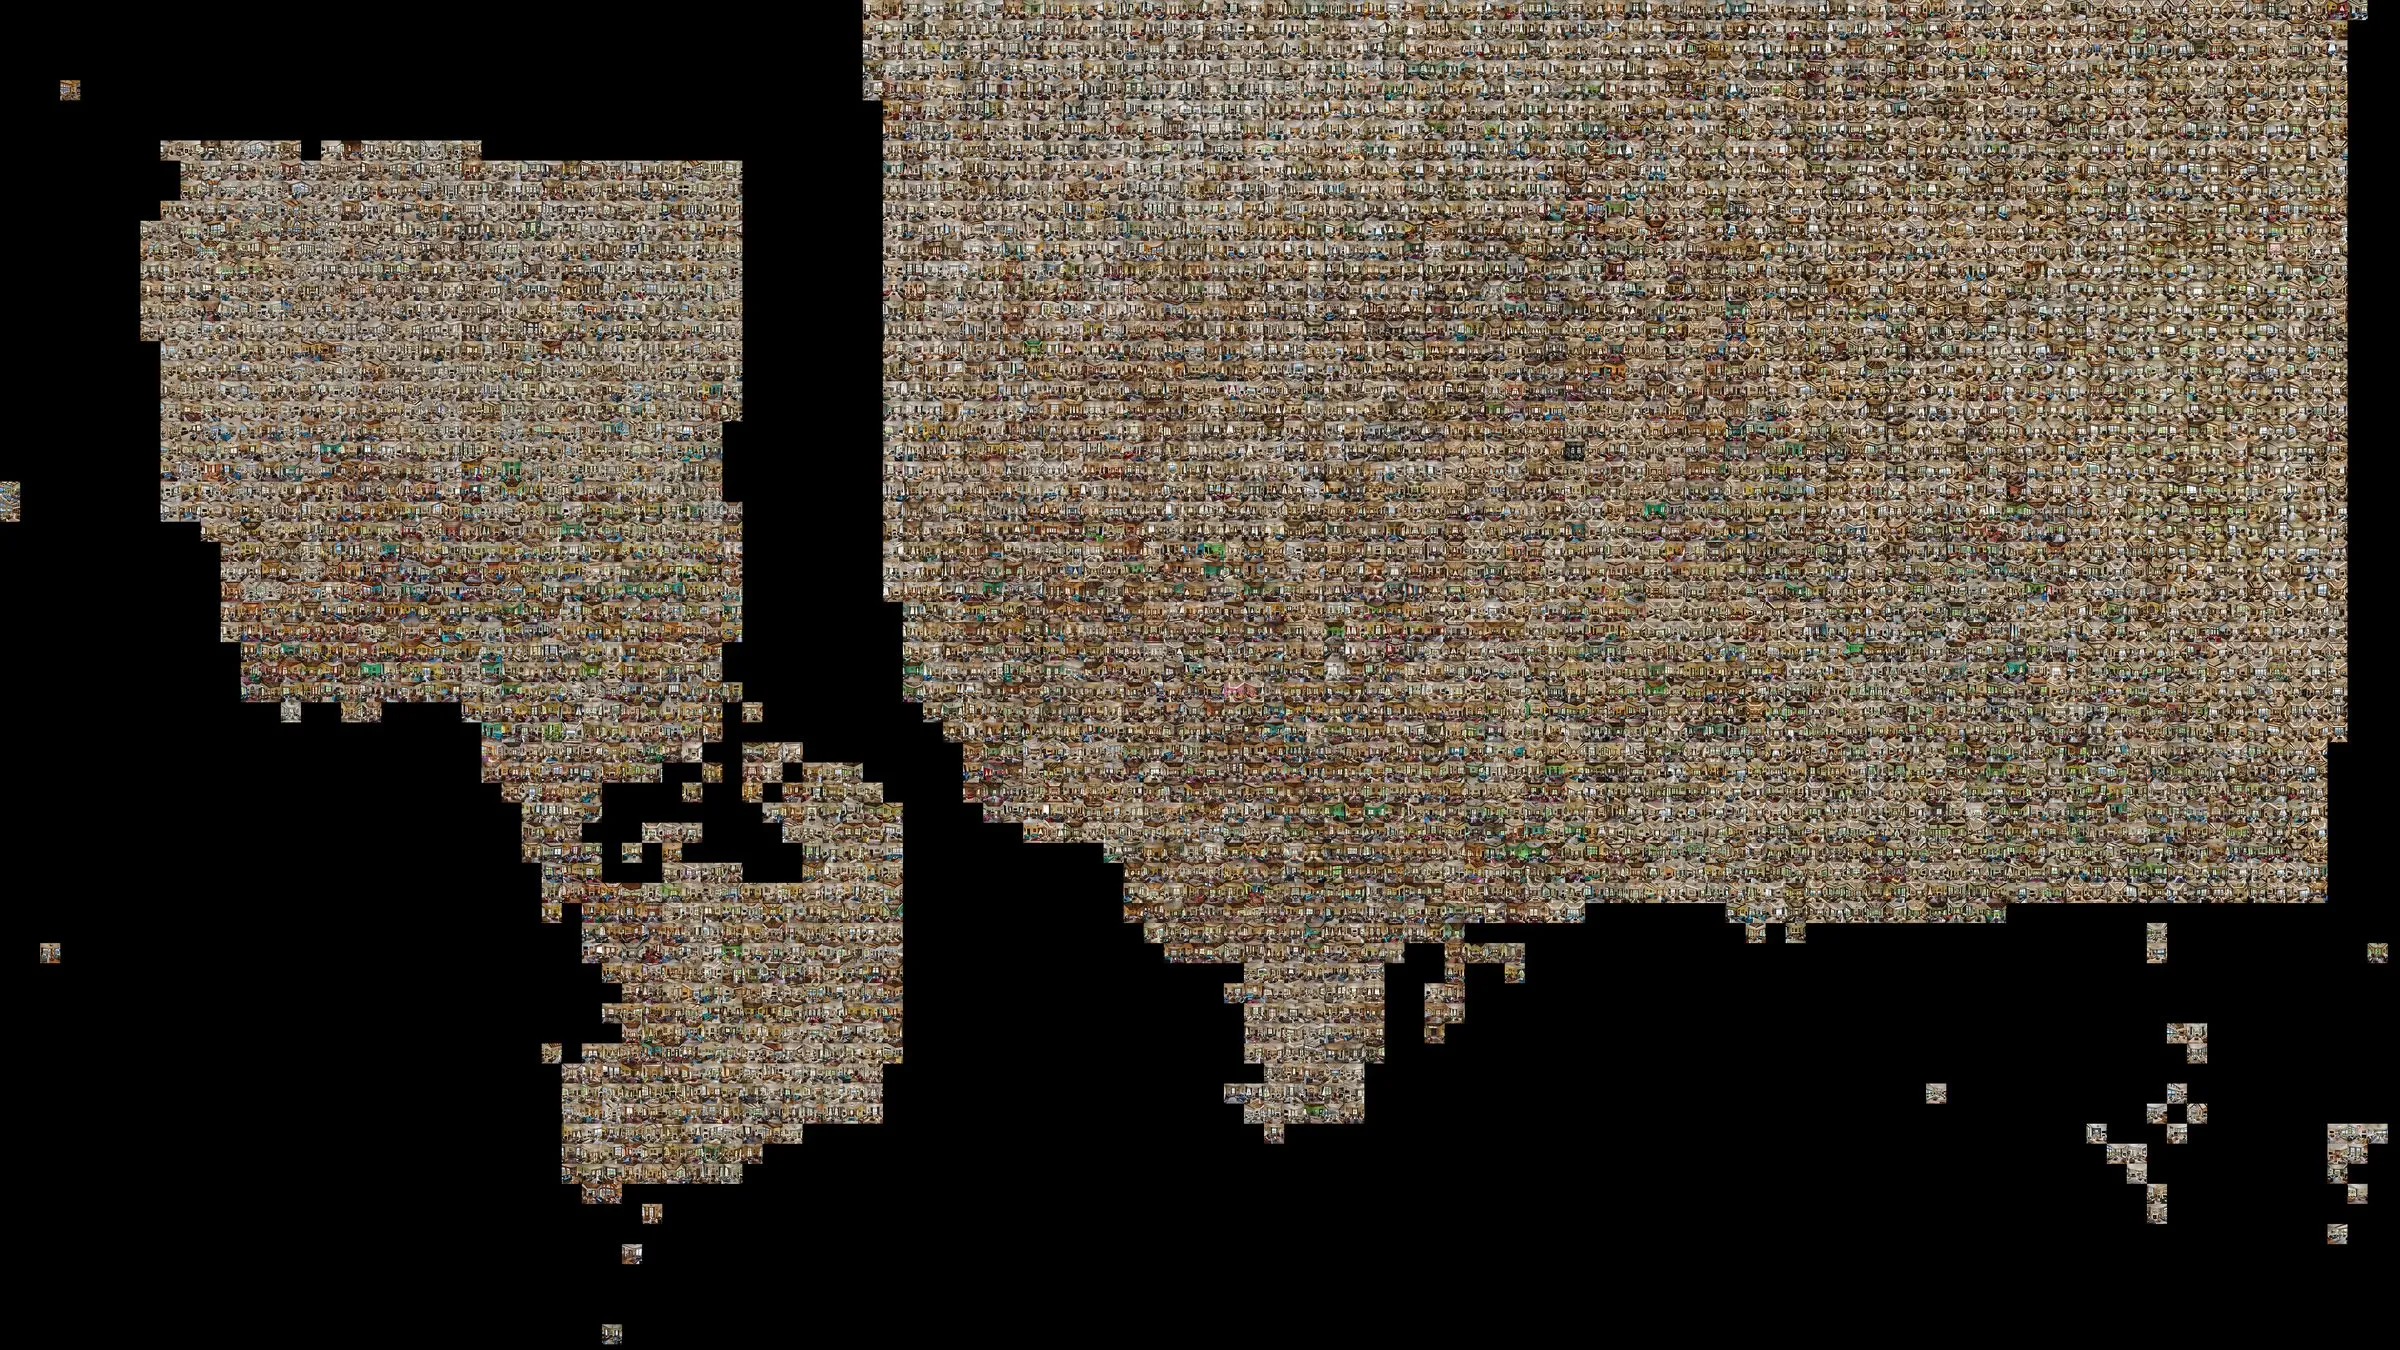
Lca map living room 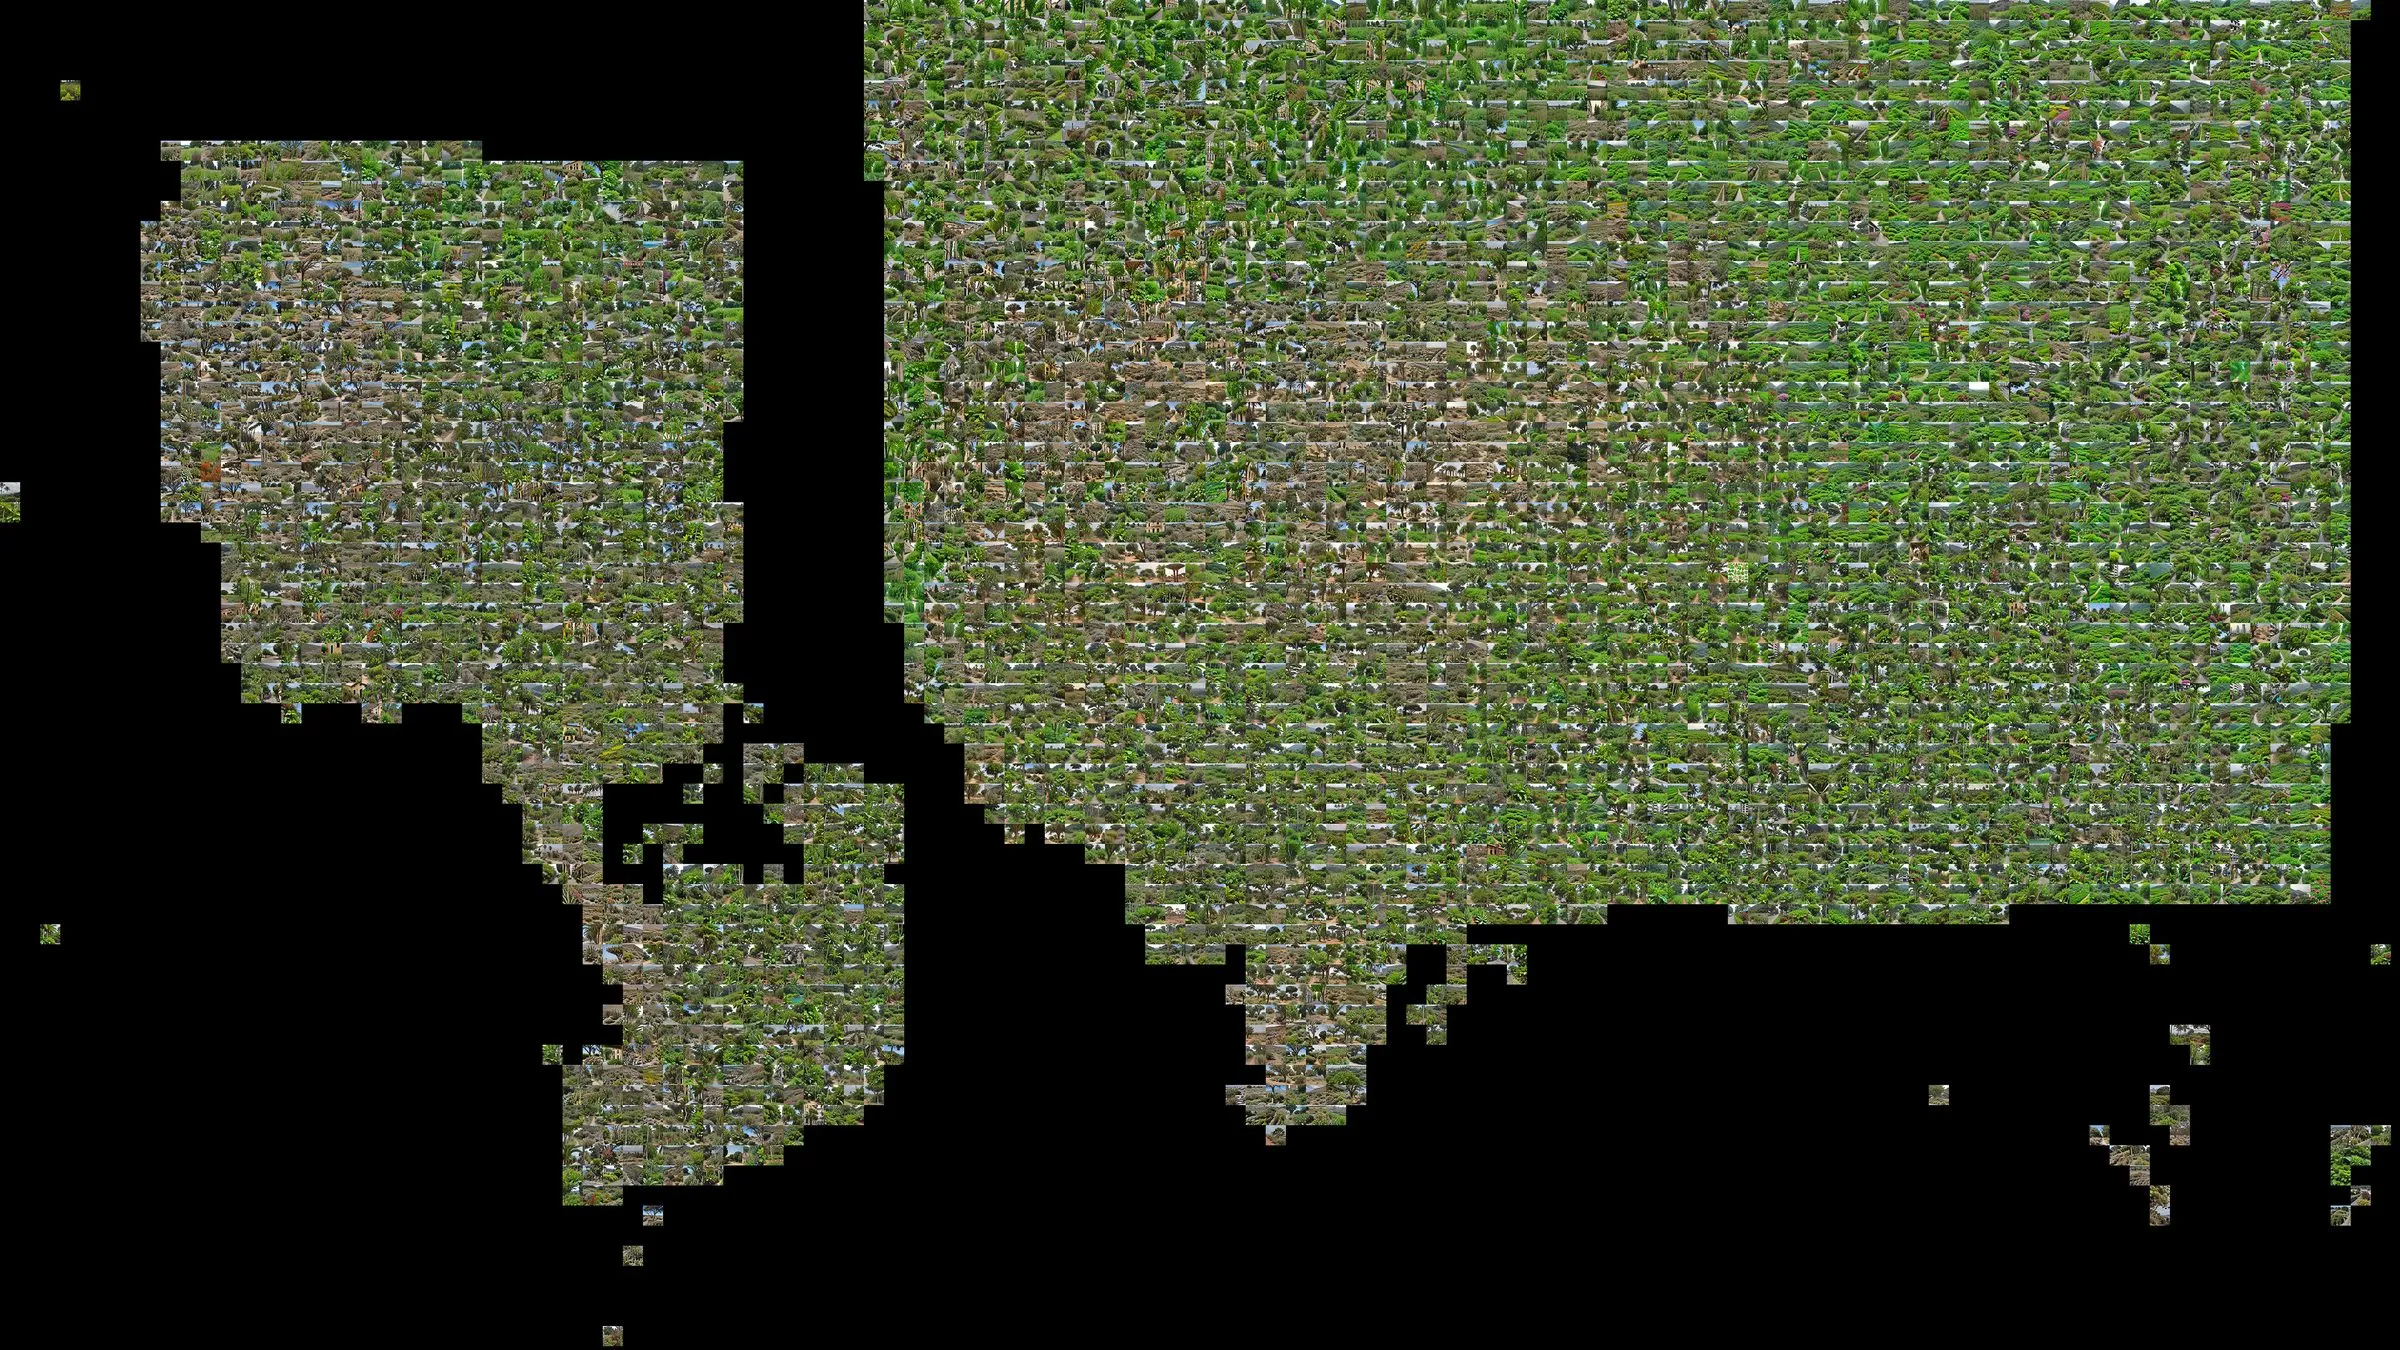
Lca map vegetation 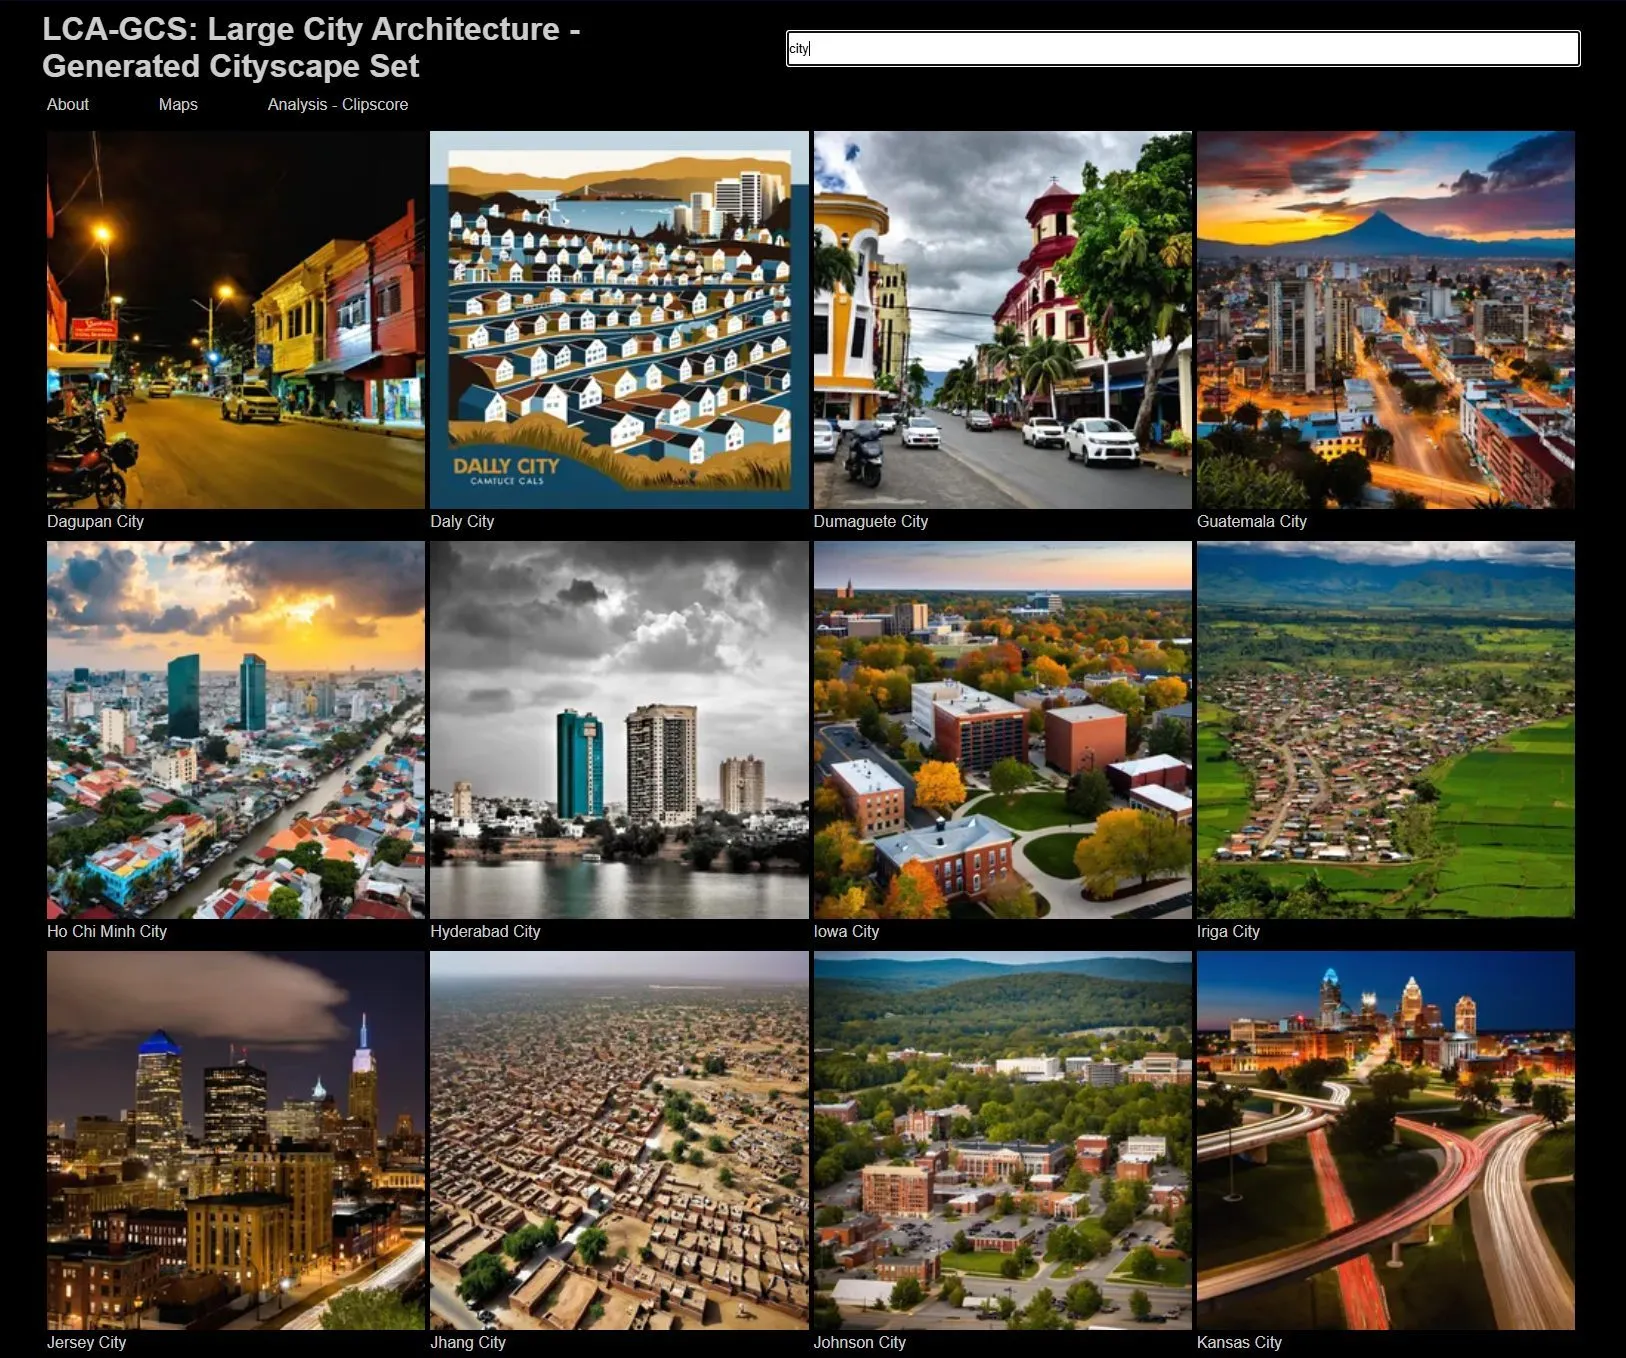
Hero site screenshot
Maps: one generated image per place
7 plates · click to enlarge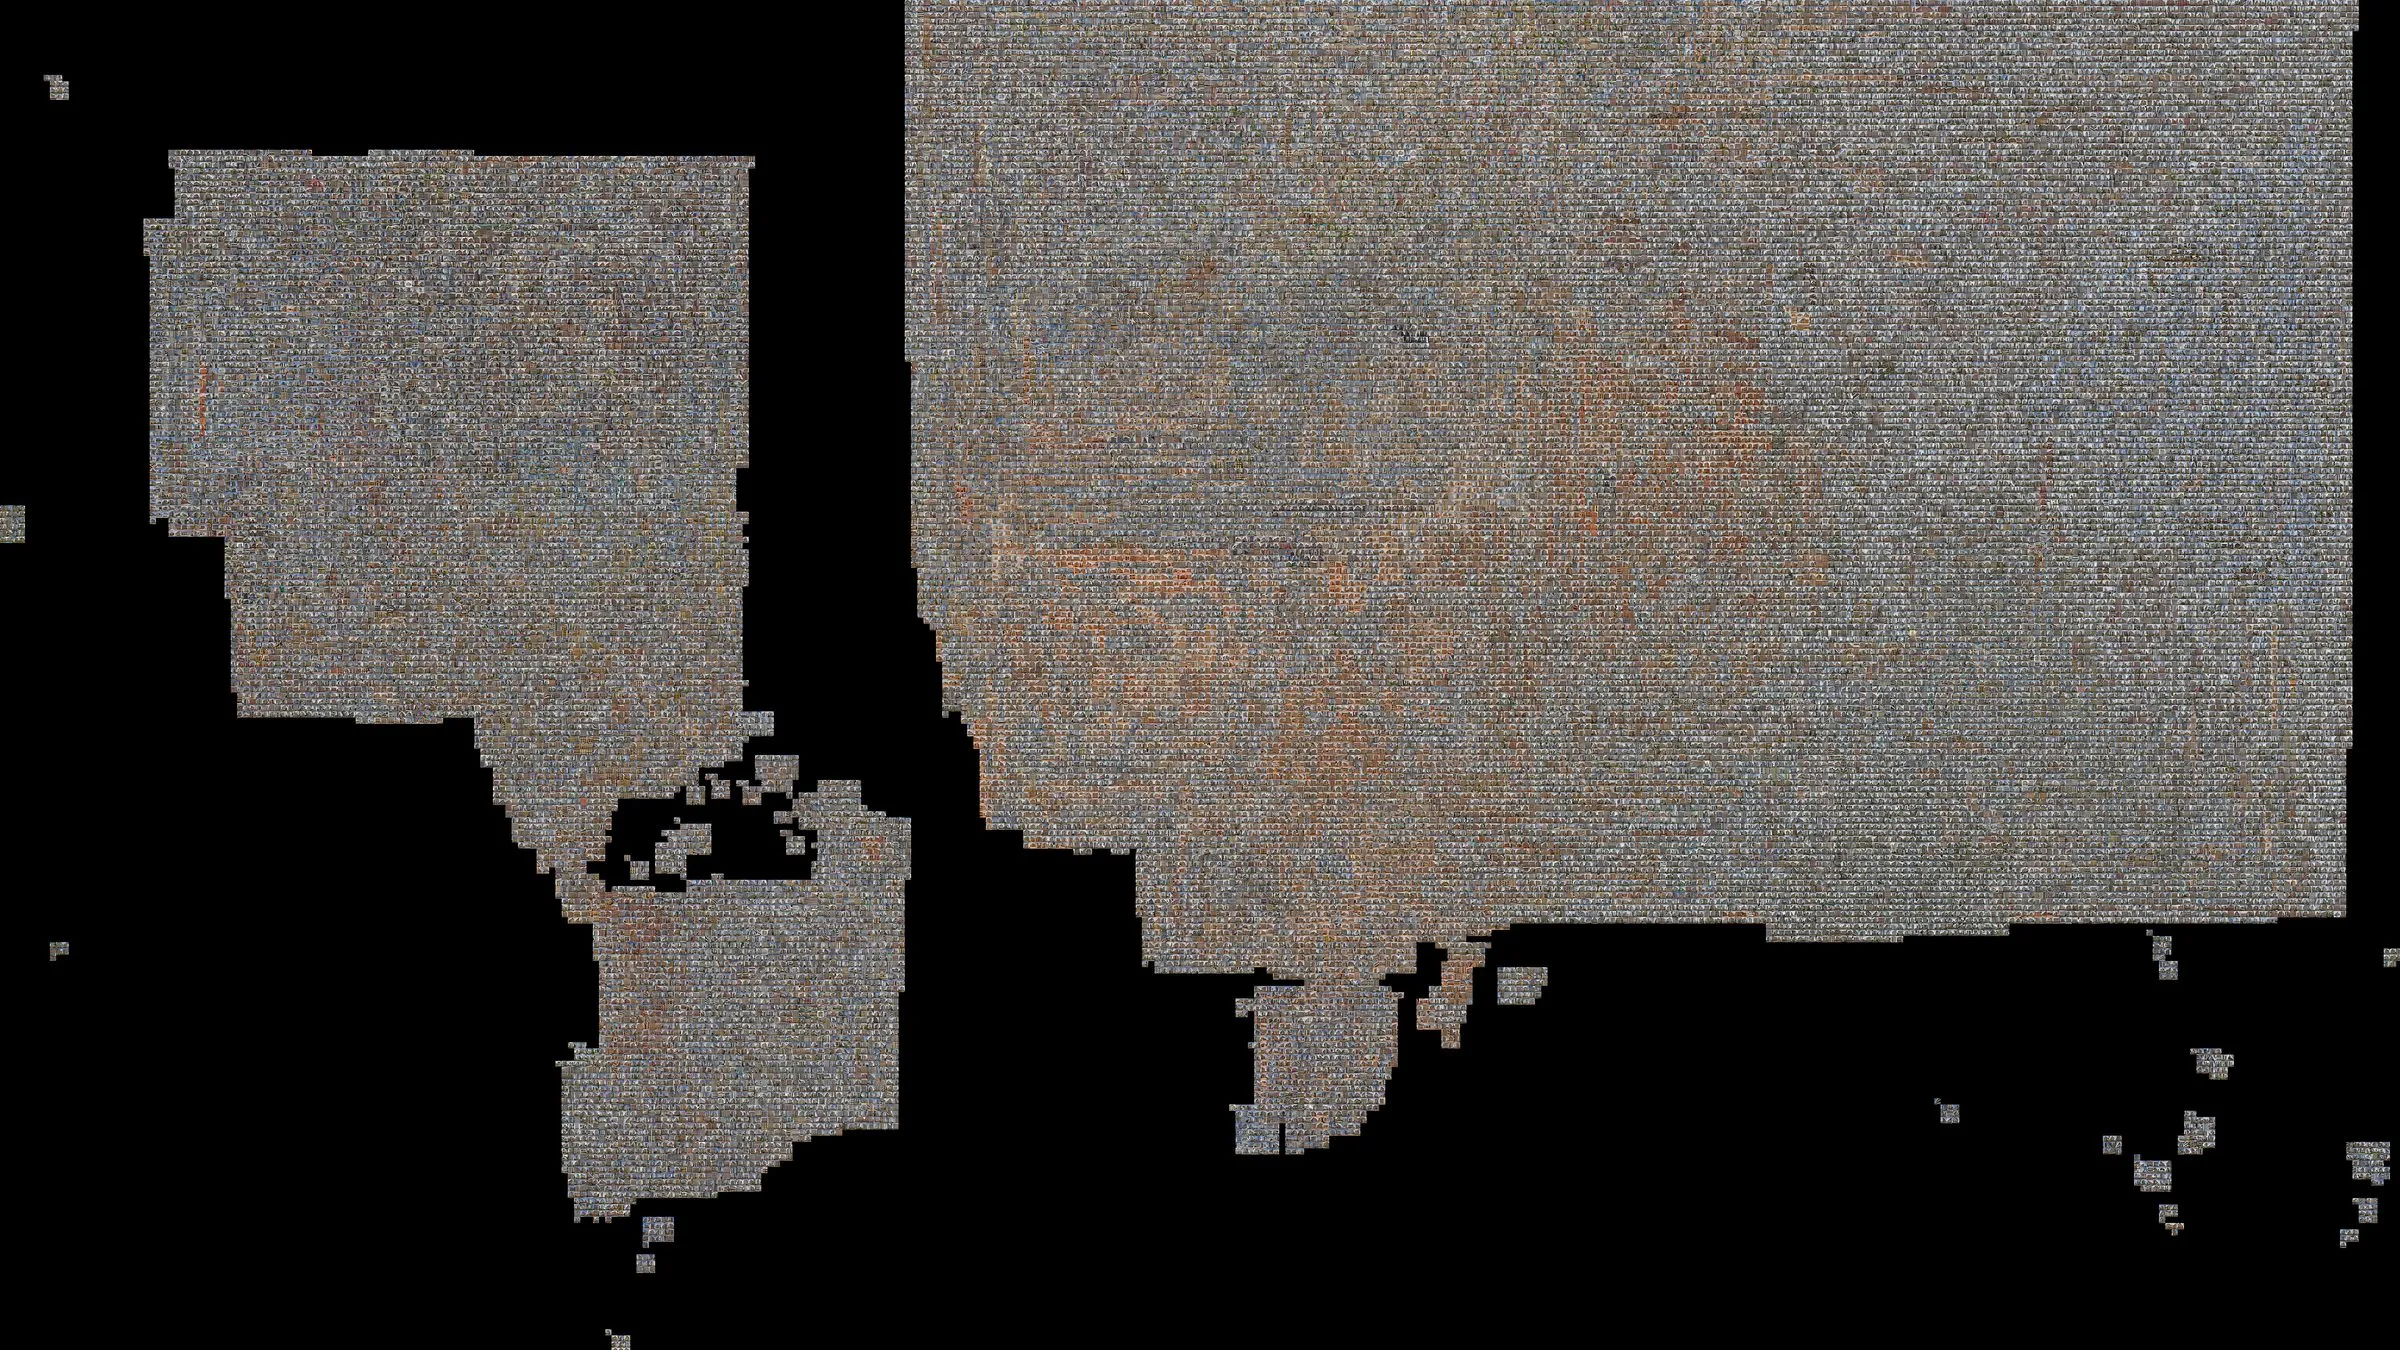
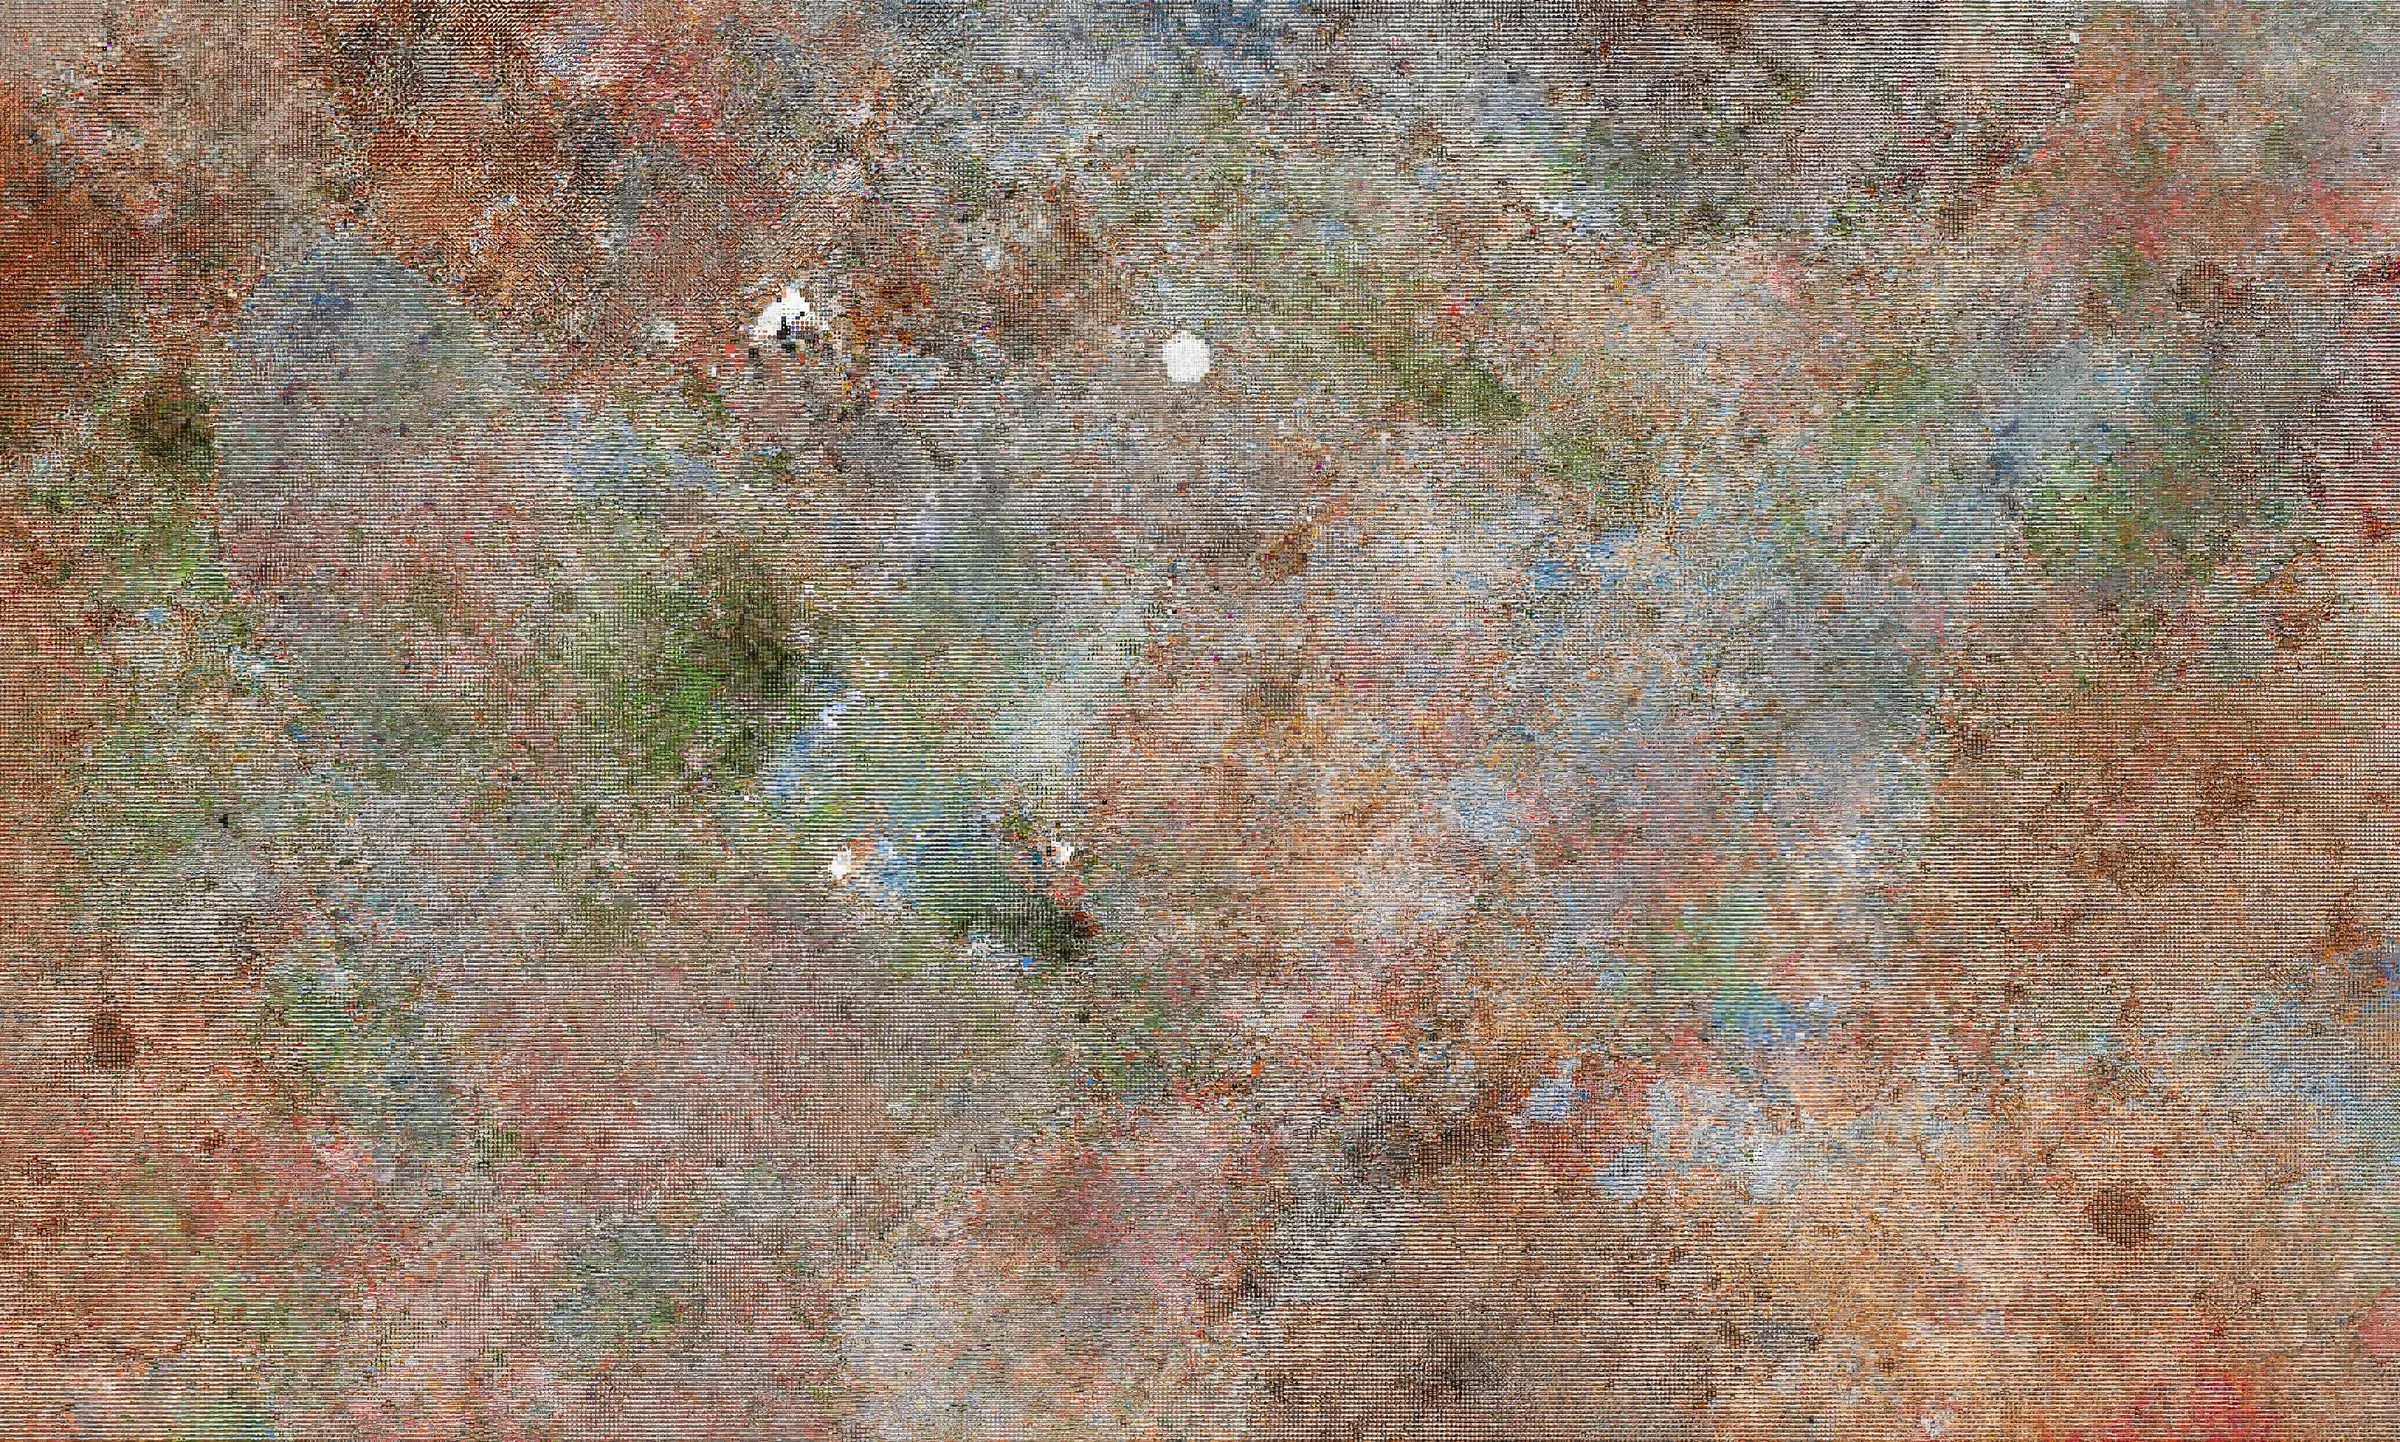
Map of Texas, prompt: building in · generated tiles, SDXL · 2023 Map of Texas, prompt: large city house, seed 3746759409 · generated tiles, SDXL · 2023 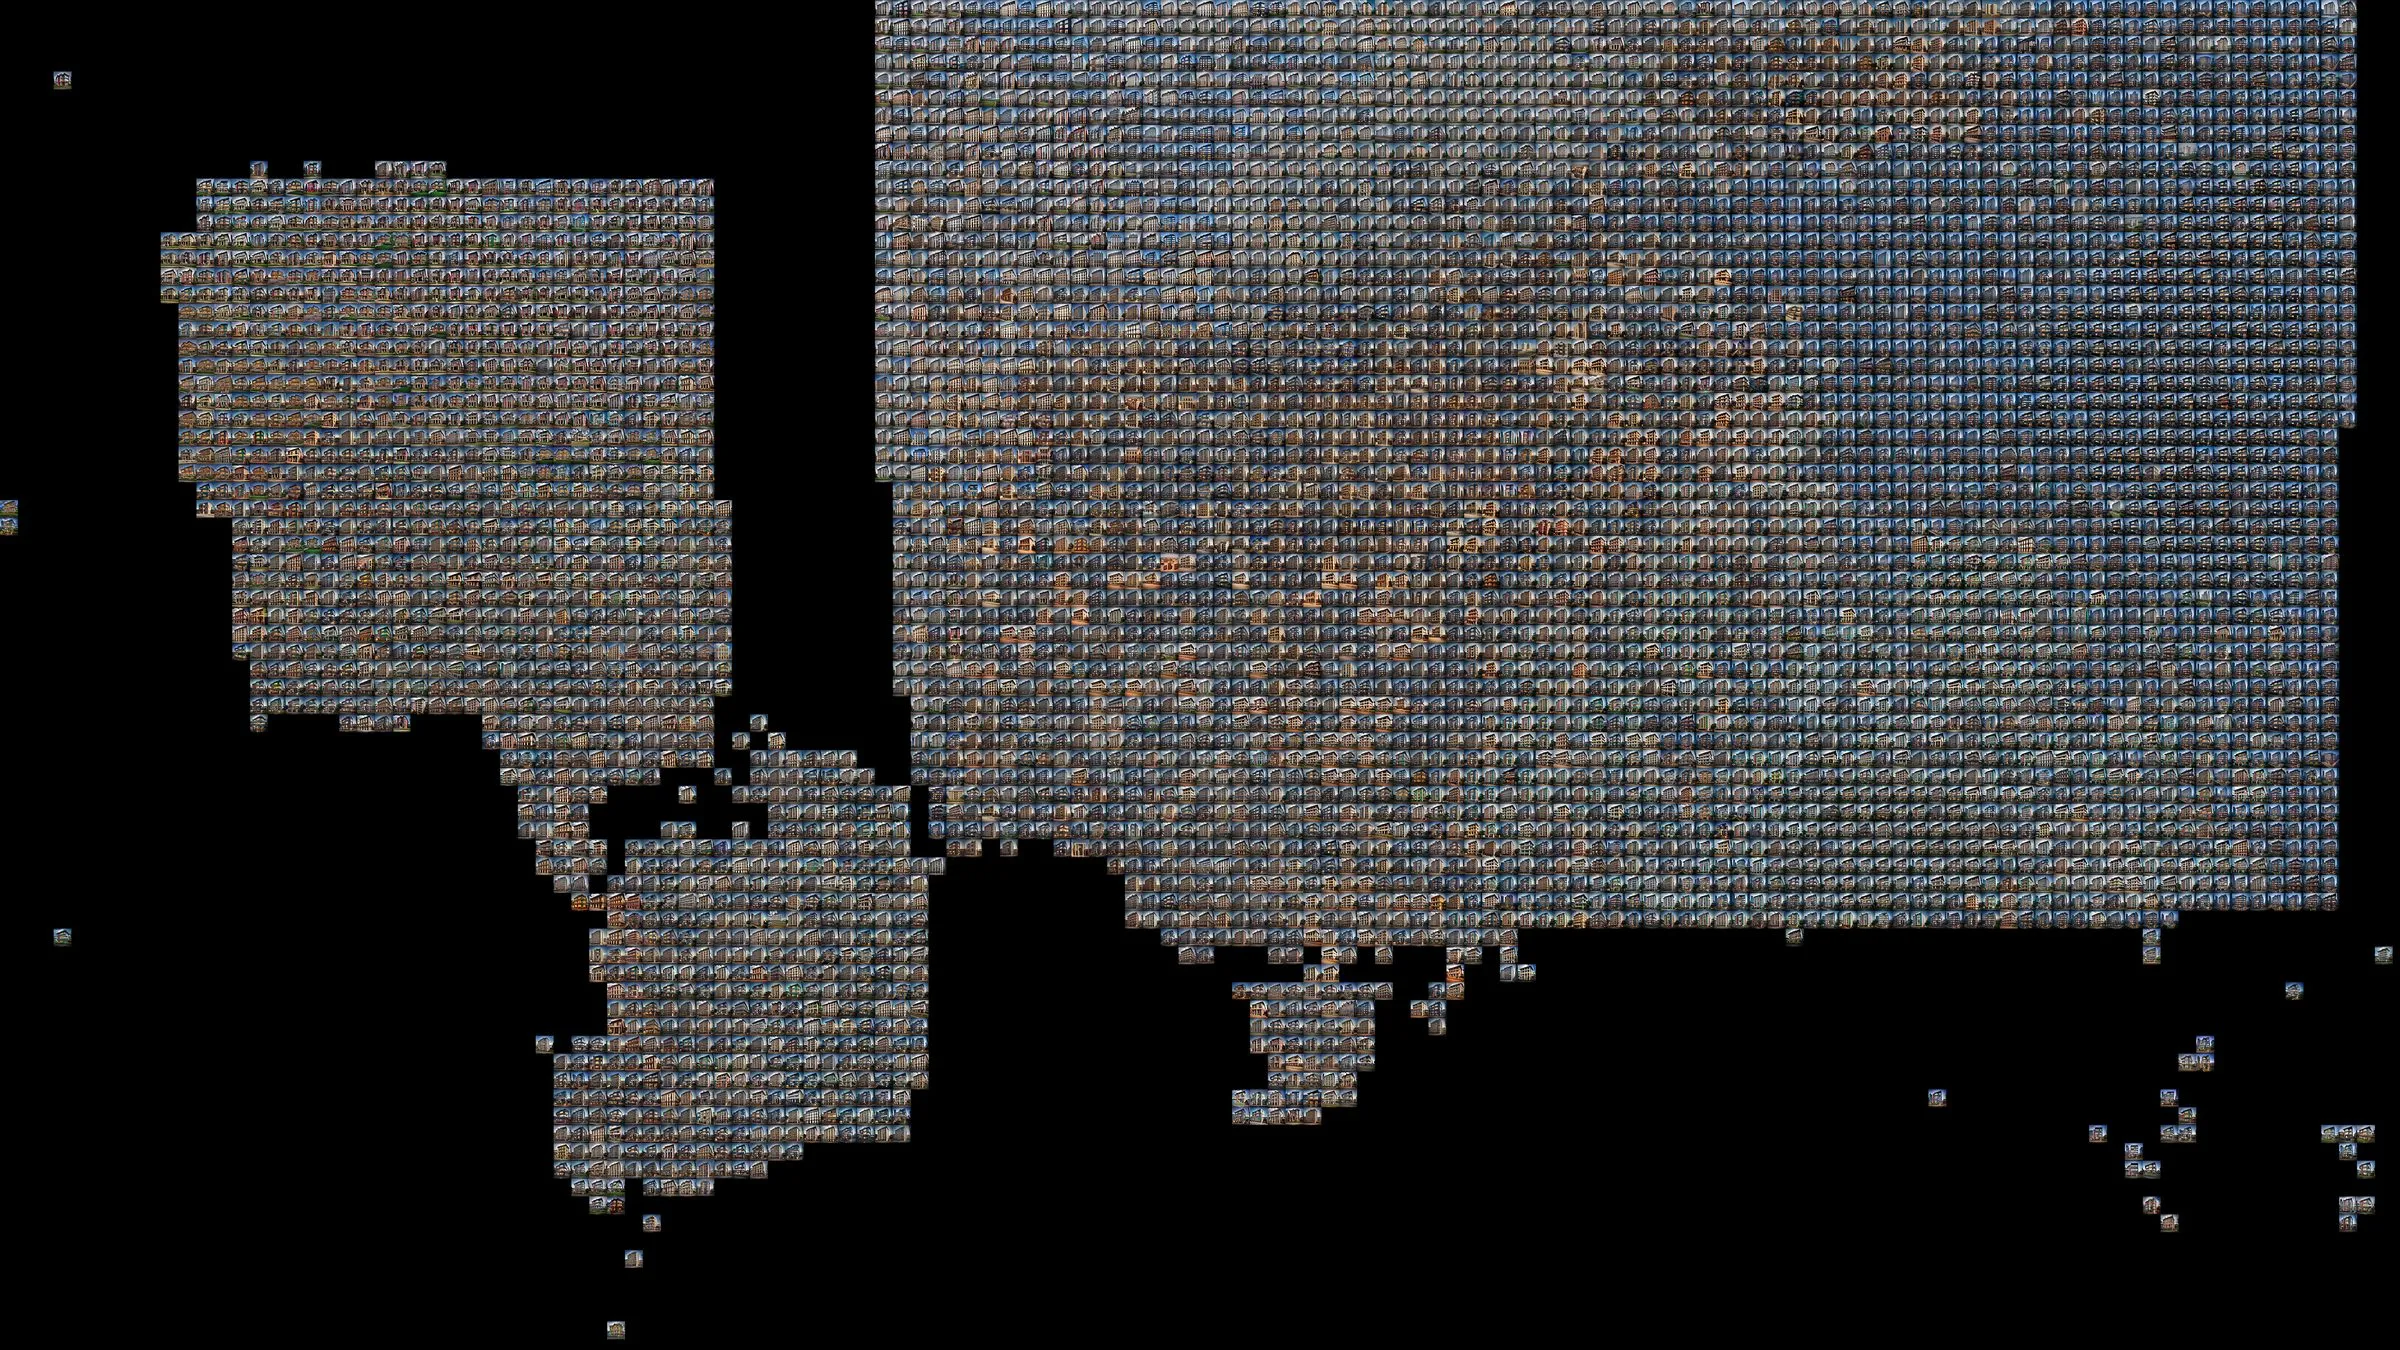
Map of Texas, prompt: large city house, seed 537608504 · generated tiles, SDXL · 2023 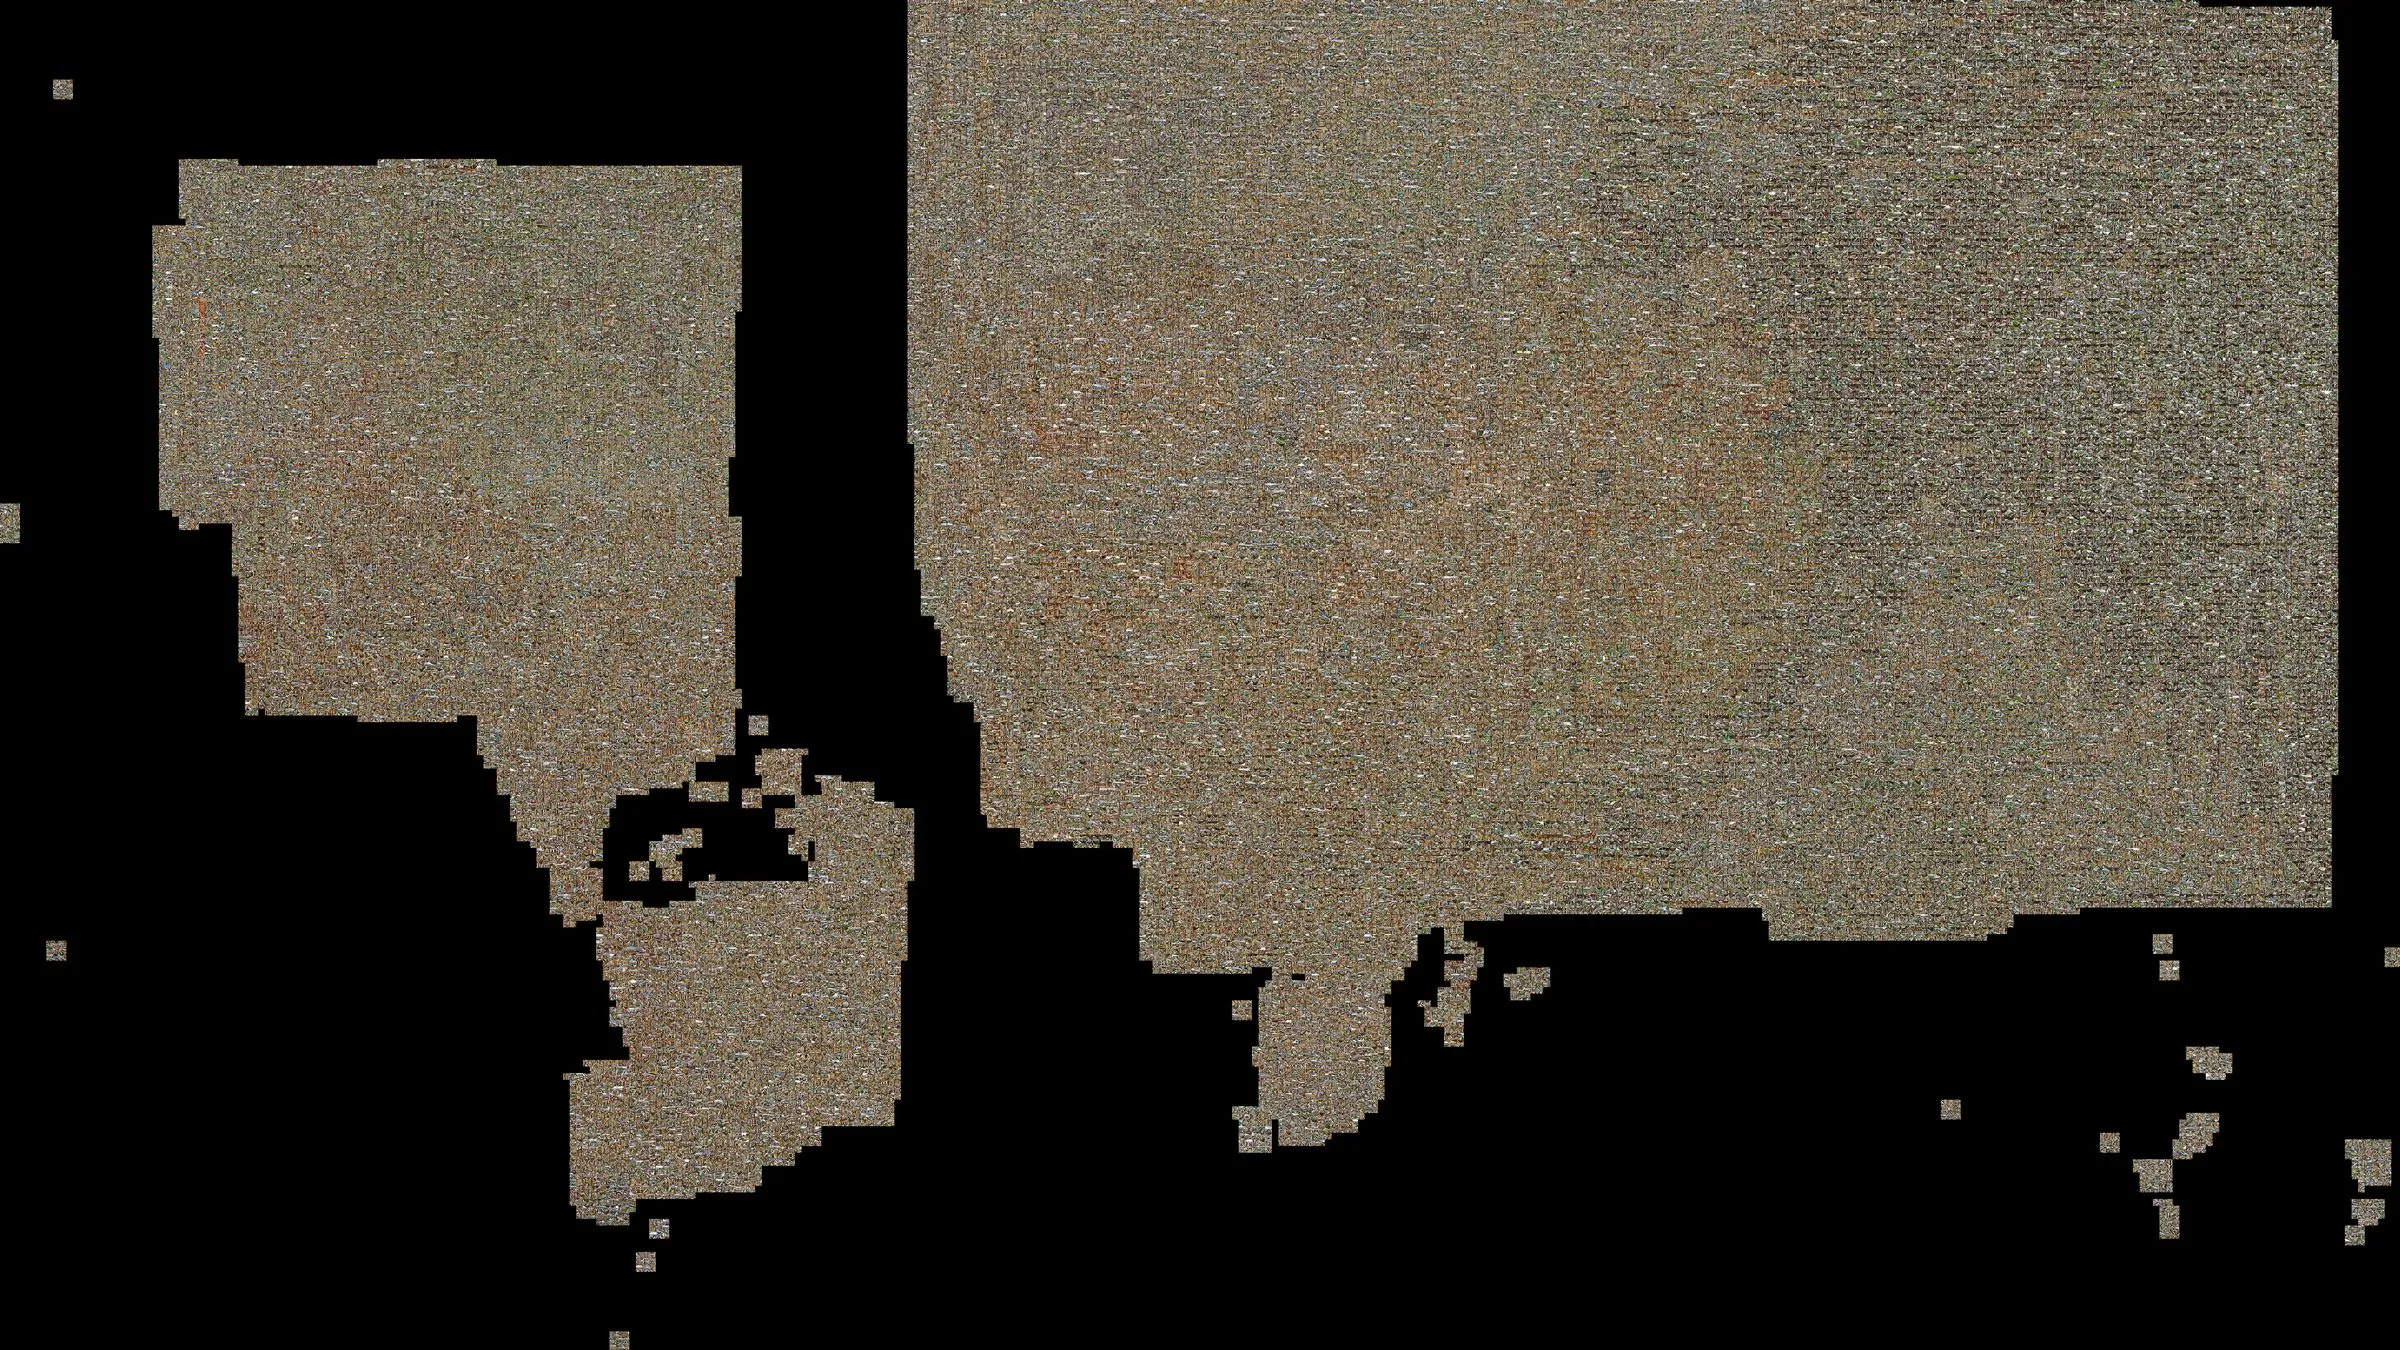
Map of Texas, prompt: building exterior · generated tiles, SDXL · 2023 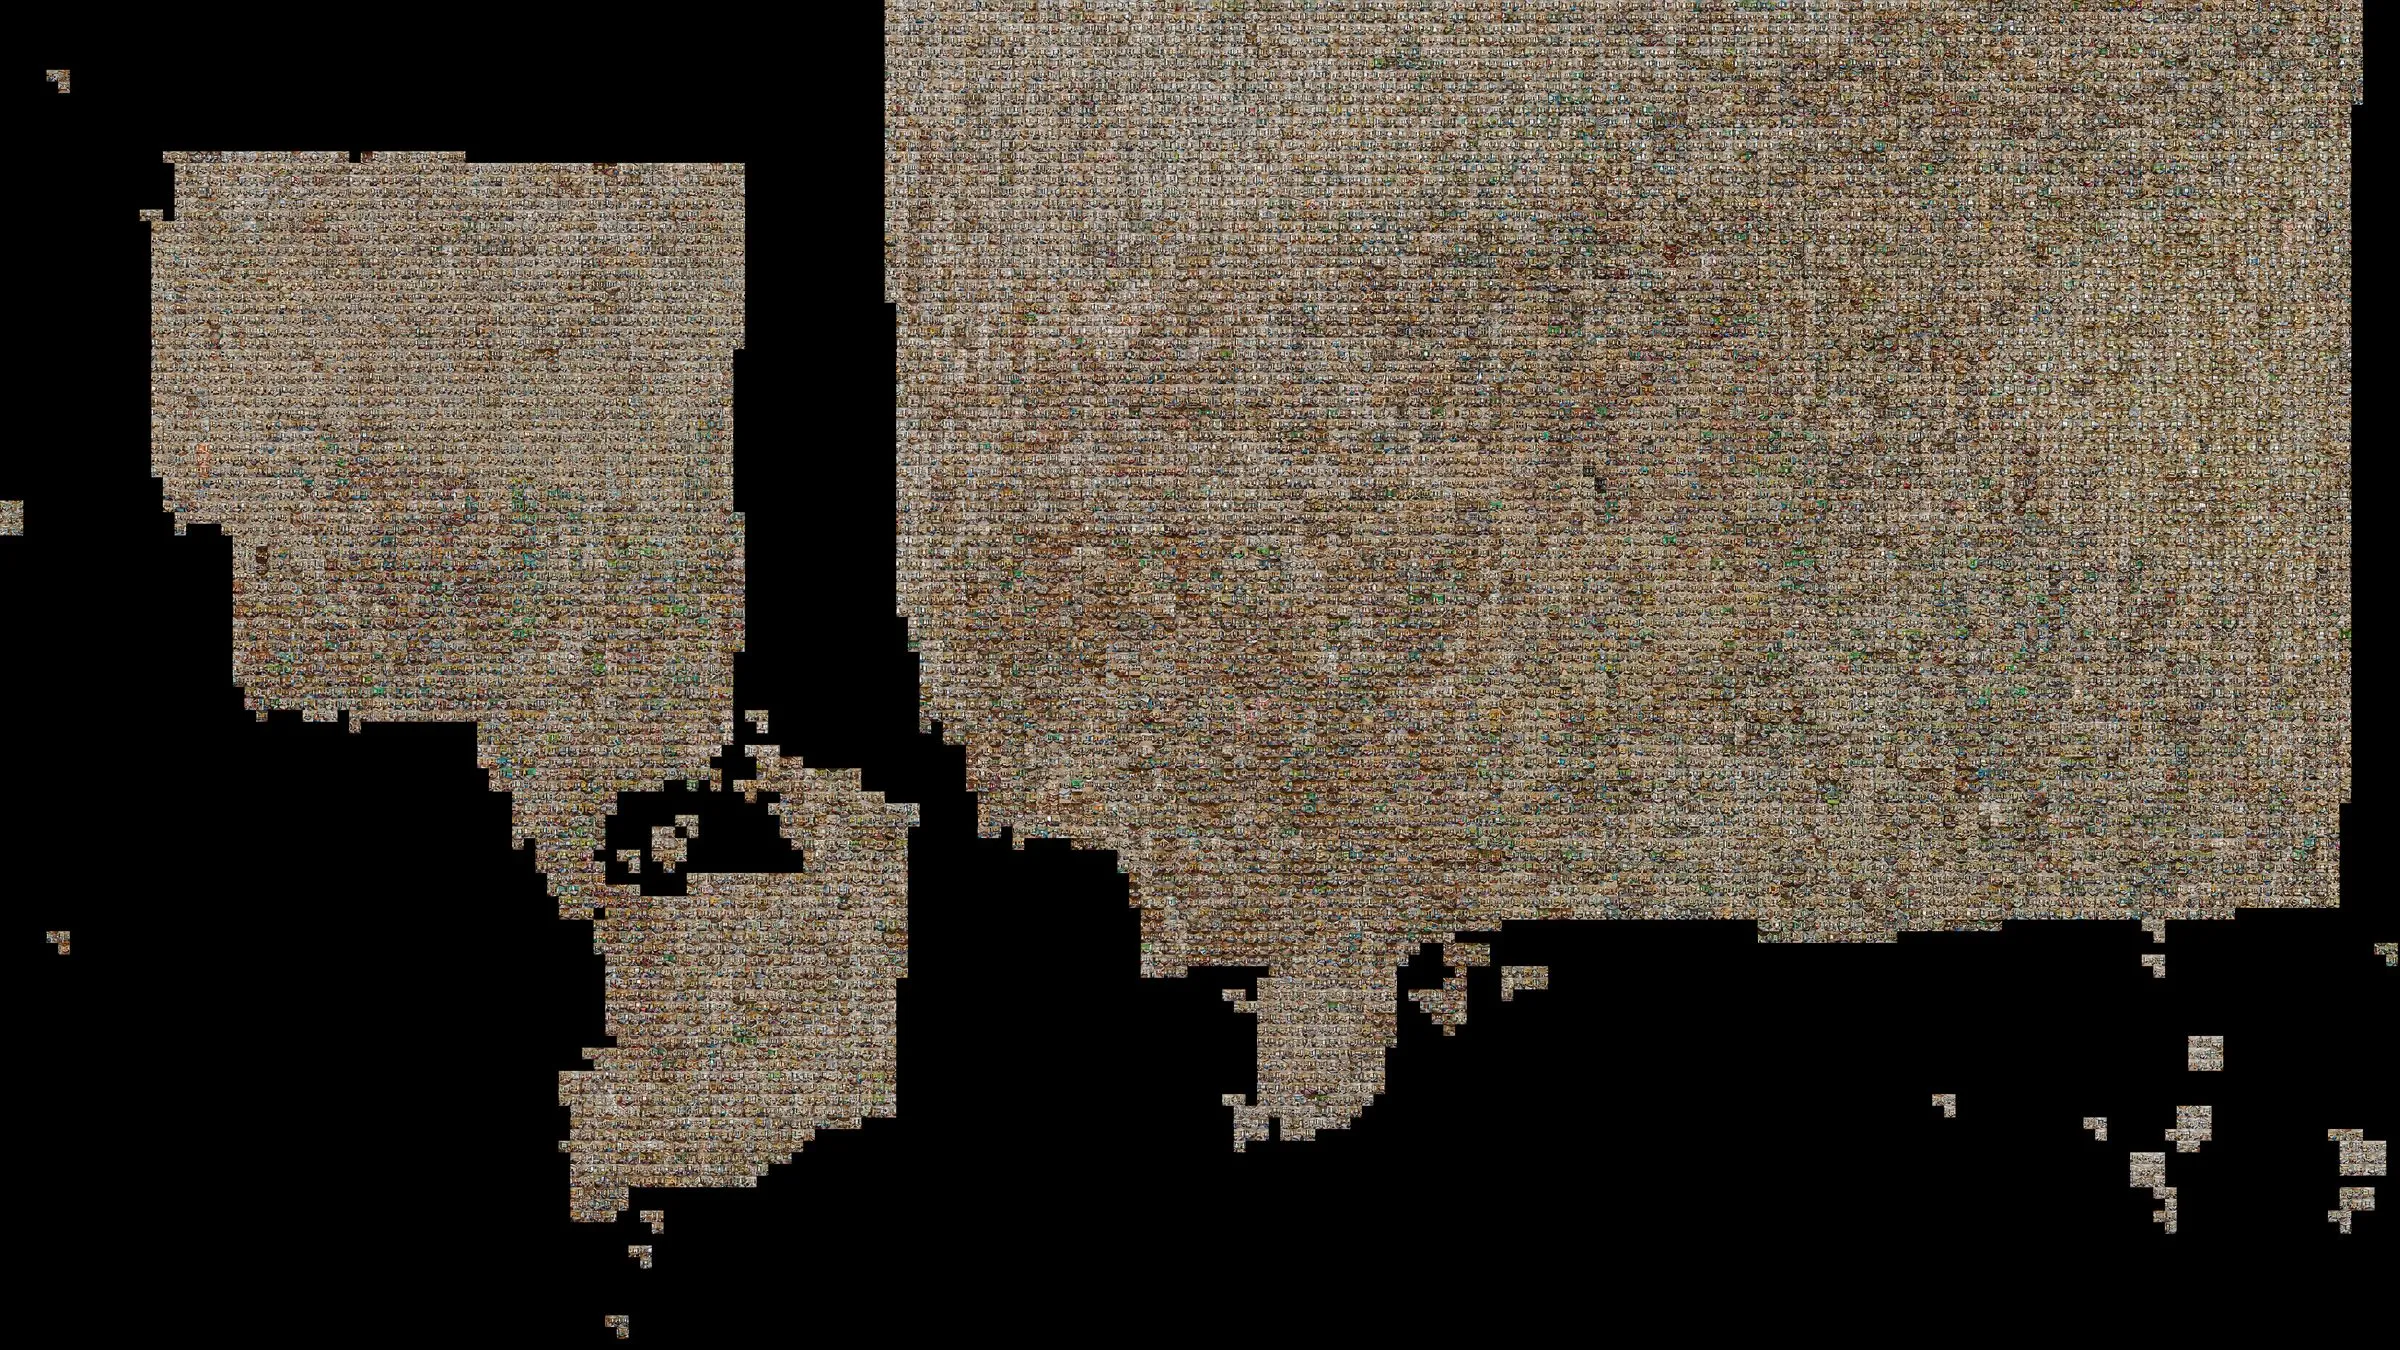
Map of Texas, prompt: interior · generated tiles, SDXL · 2023 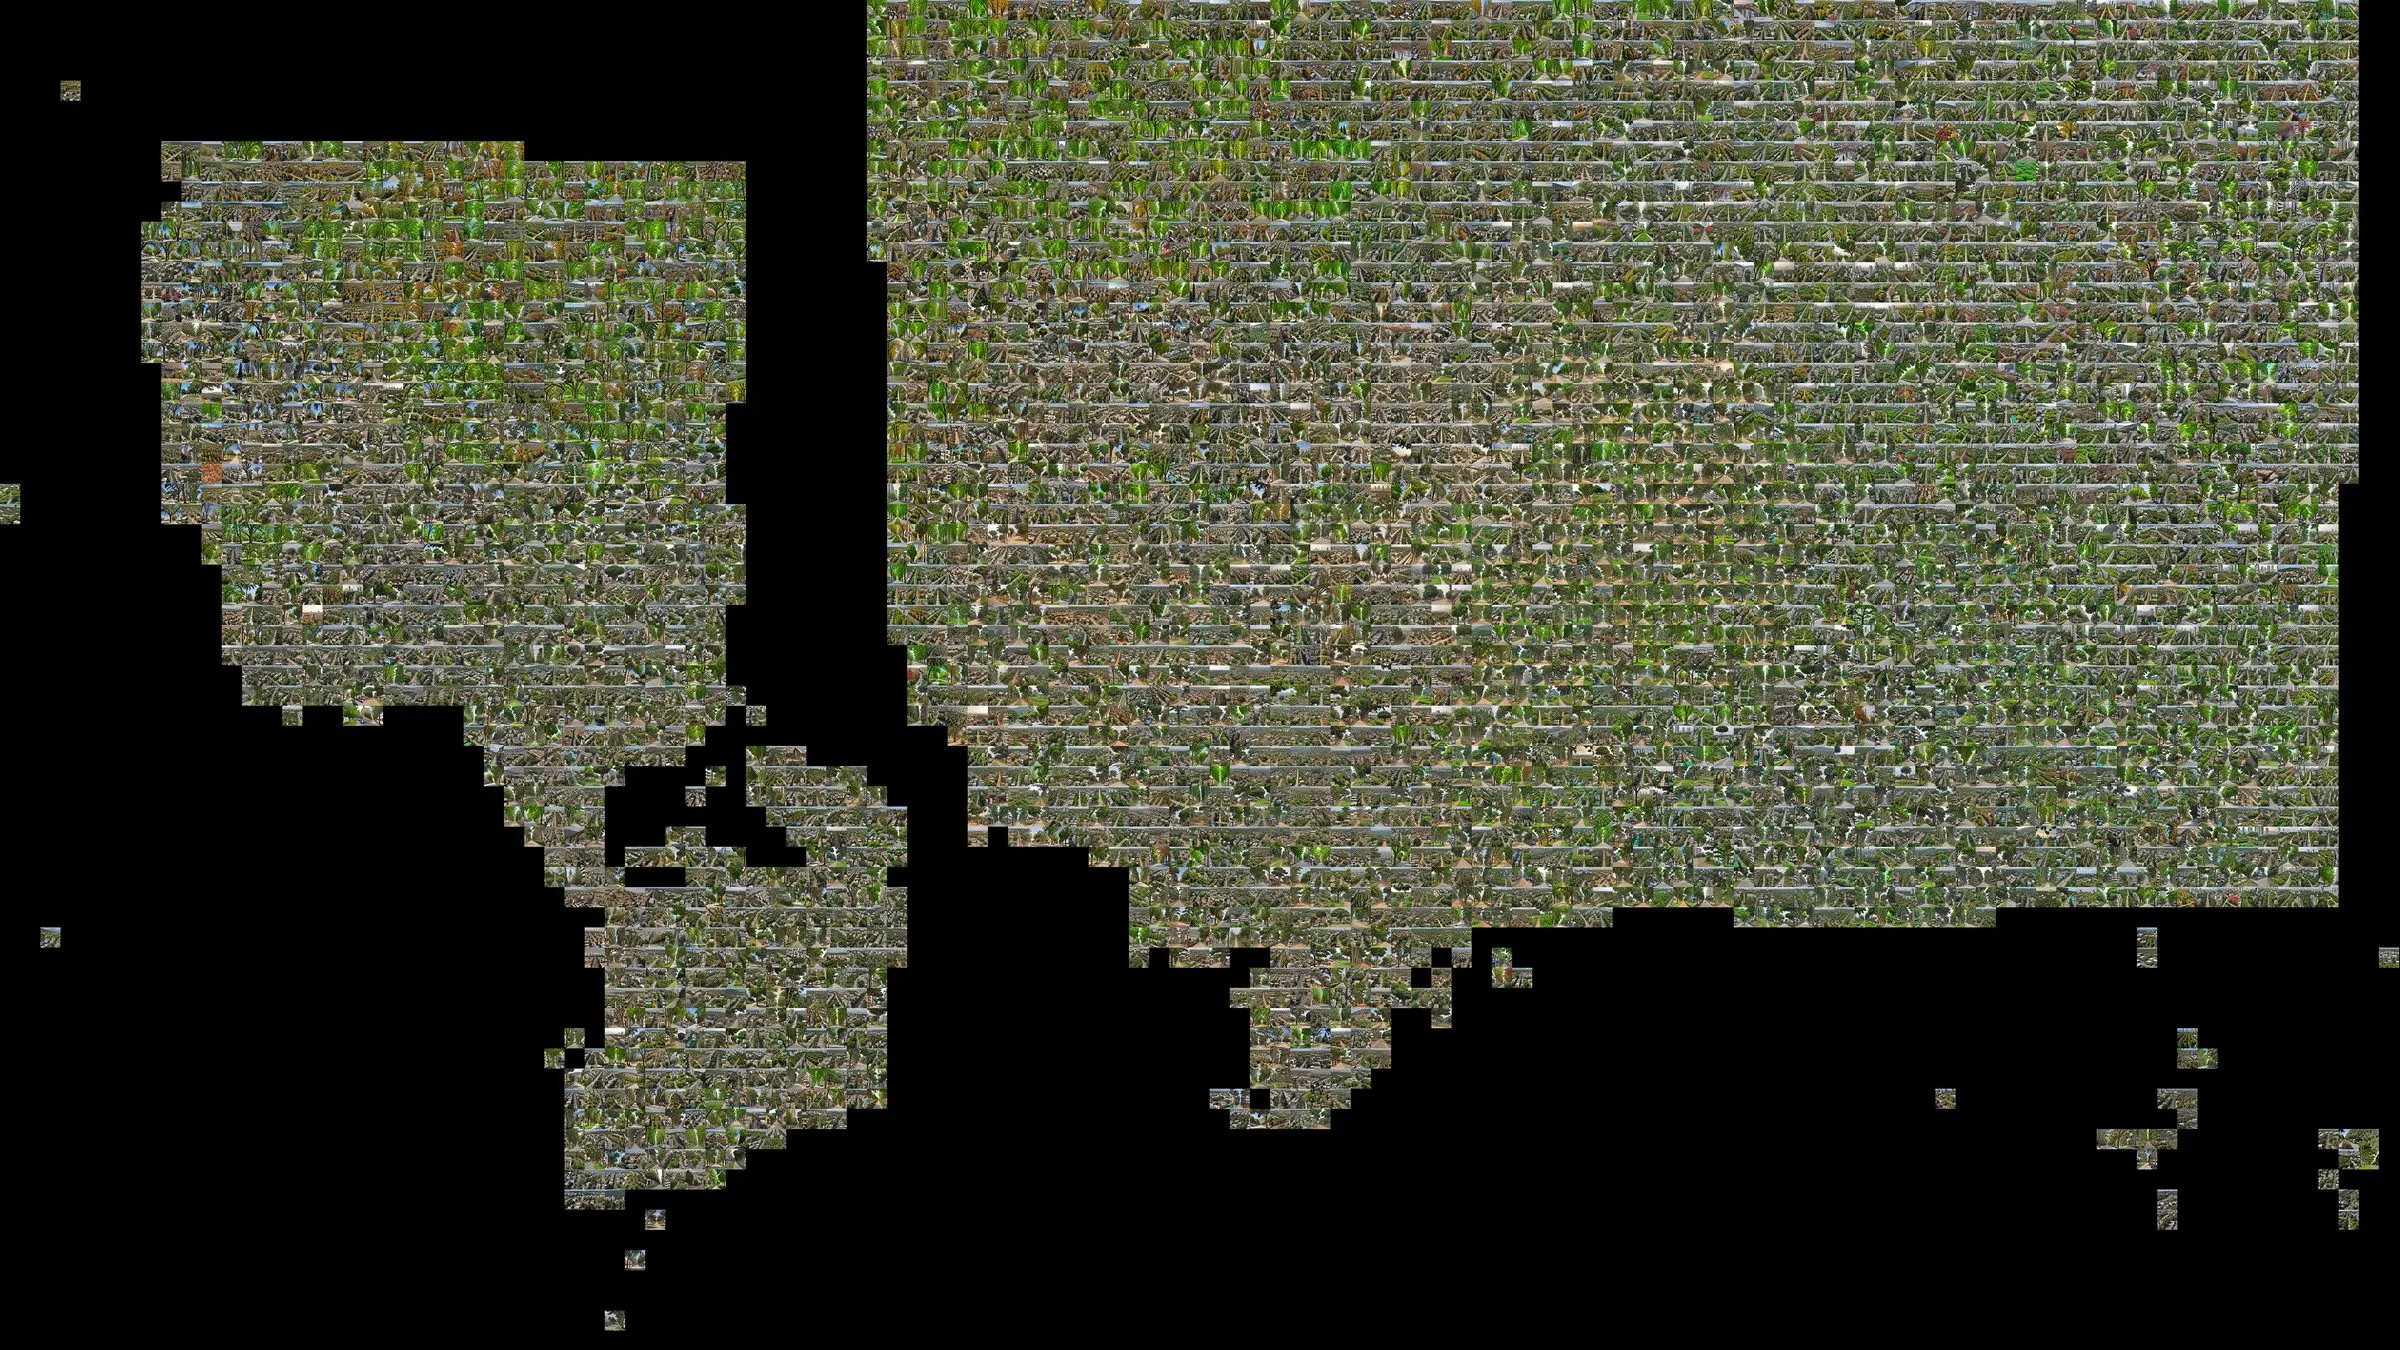
Map of Texas, prompt: urban forest · generated tiles, SDXL · 2023 Map of Texas, embodied carbon, segmented with SAM · generated tiles, SDXL · 2023
Related
4 entries