One Year Austin
2021 · installationHow much does a city pave in a year, and how much forest would absorb it?
- year
- 2021
- type
- installation
- status
- The print was the background of Large City Architecture Research, Mebane Gallery, UT Austin, January 19 to April 15, 2022; presented at UT GIS Day, November 17, 2021
- credit
- Daniel Koehler. Video and a 19 by 2 metre print; shown in Large City Architecture Research, Mebane Gallery, UT Austin, 2022.
- program
- Large City Architecture
- where
- Austin
- no.
- 022

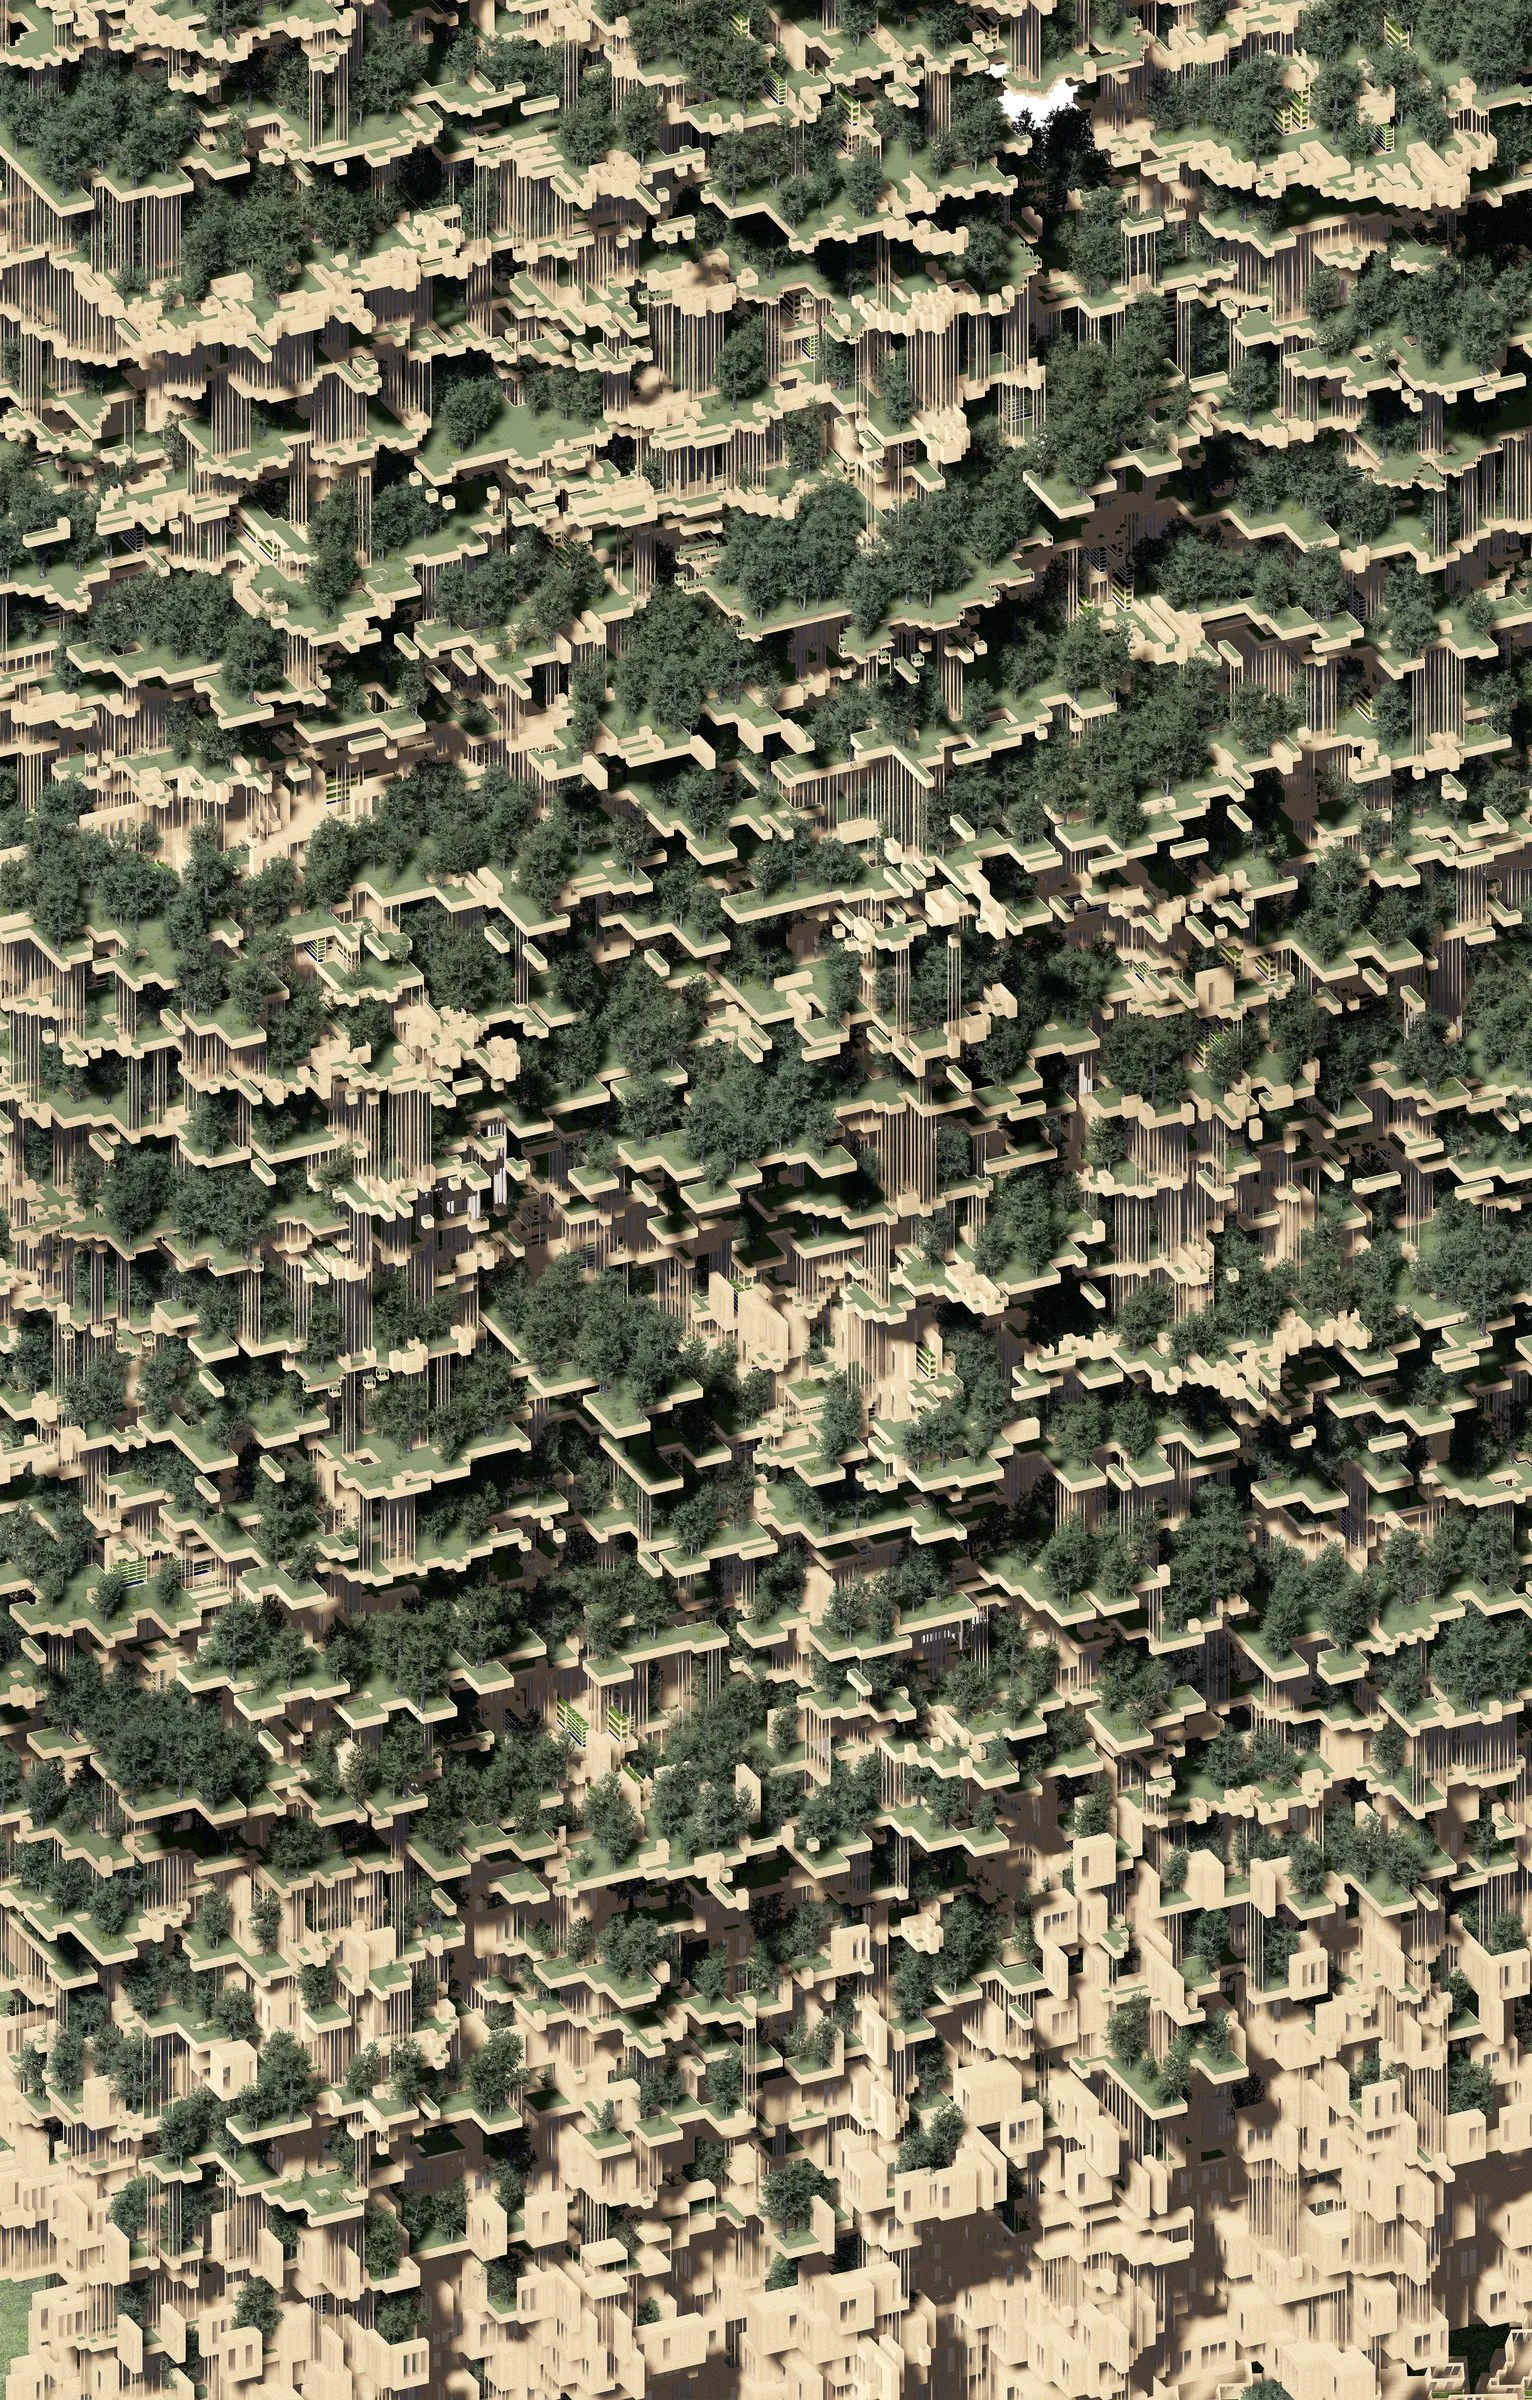
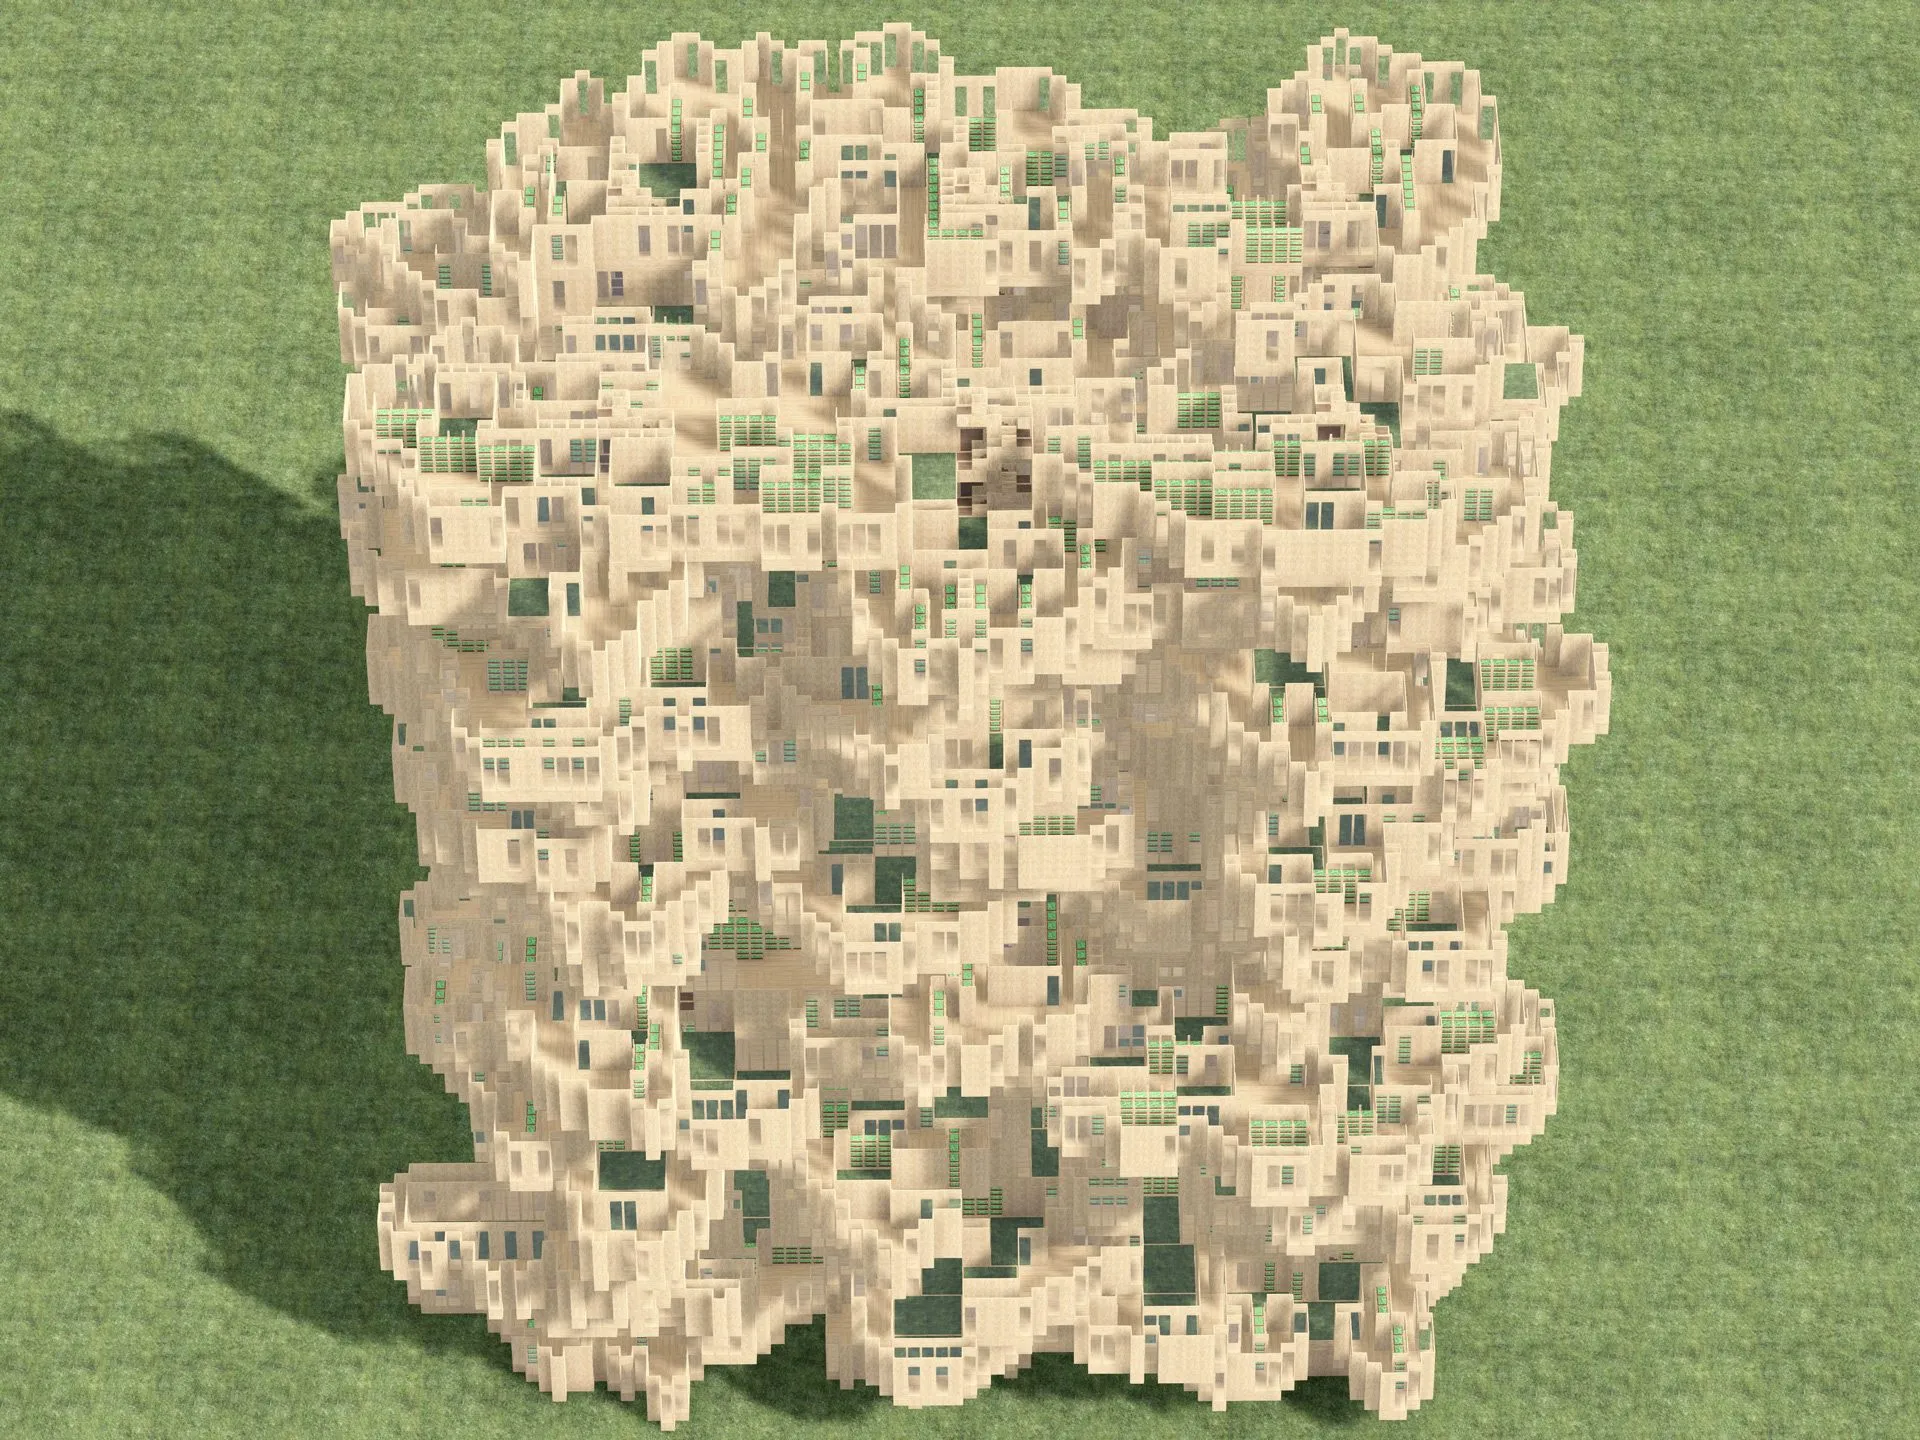
GIS lets a city be planned at high resolution, and the same data lets small interventions be read at regional scale. I wanted to show how a city manifests through its datasets: by rearranging building footprints, the drawings visualize seemingly simple queries, how much area Austin paves per year, how much forest one year of its emissions would need, and make the magnitude of ordinary land-use practice visible.
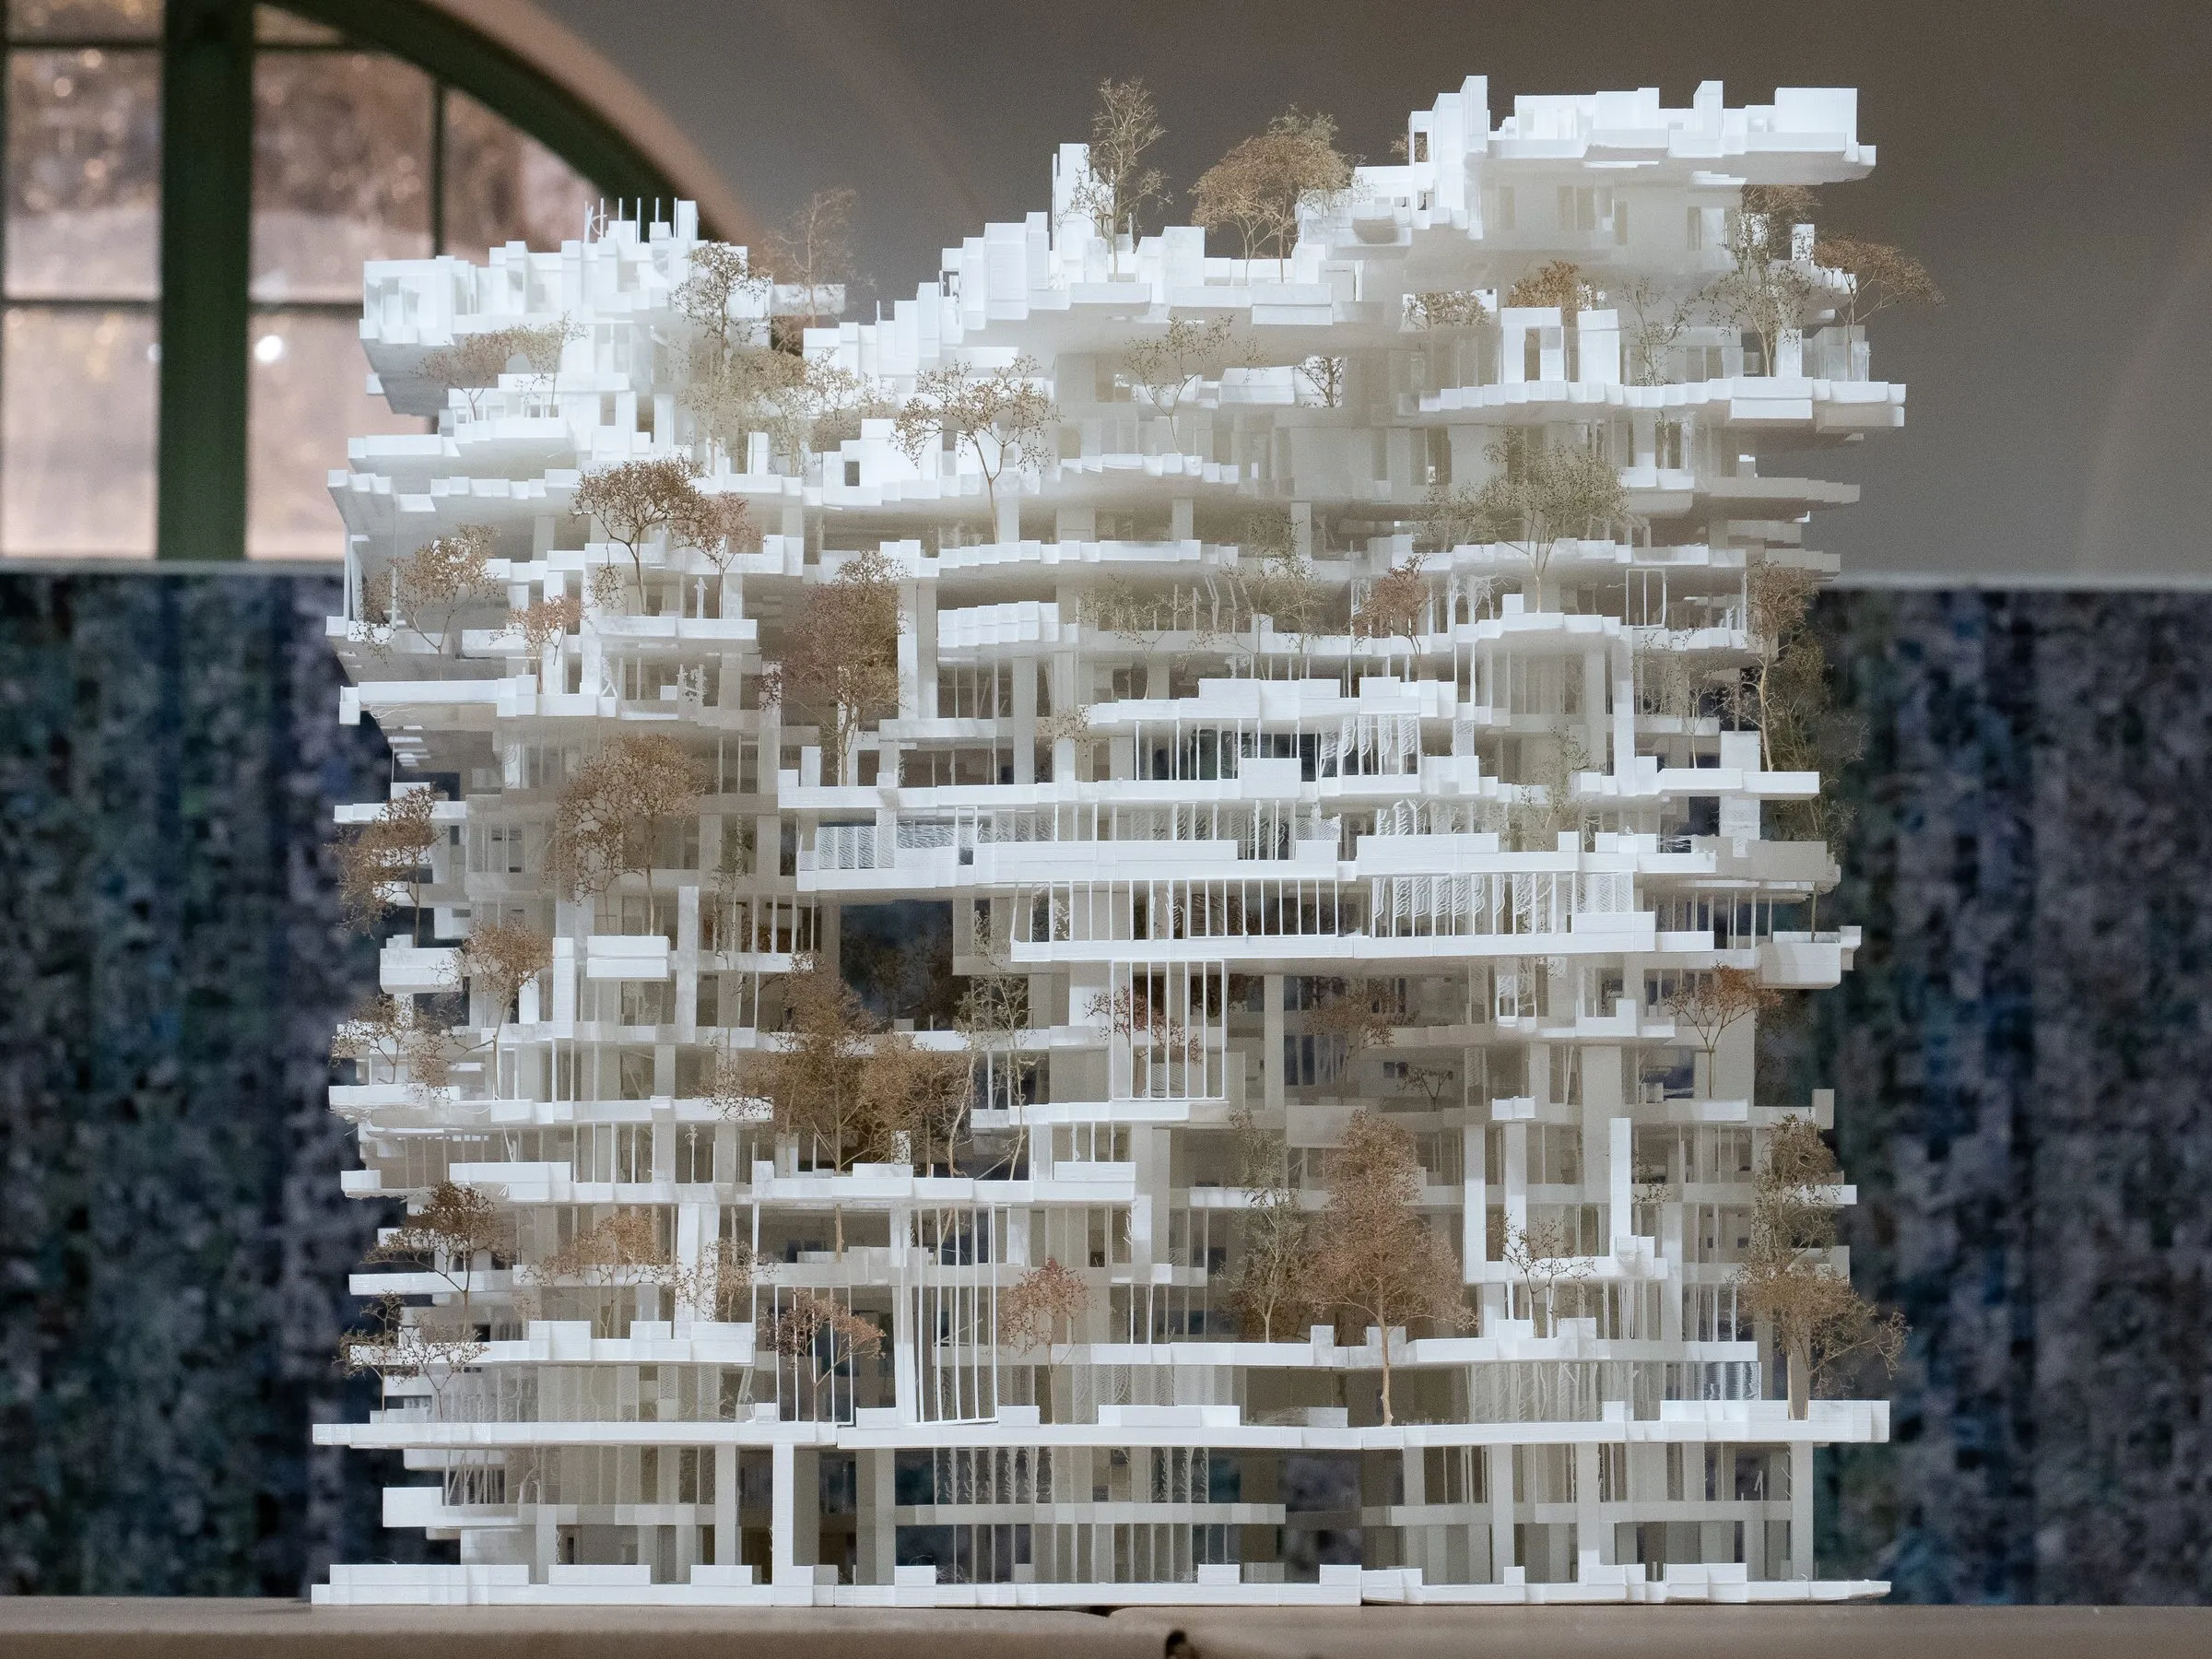
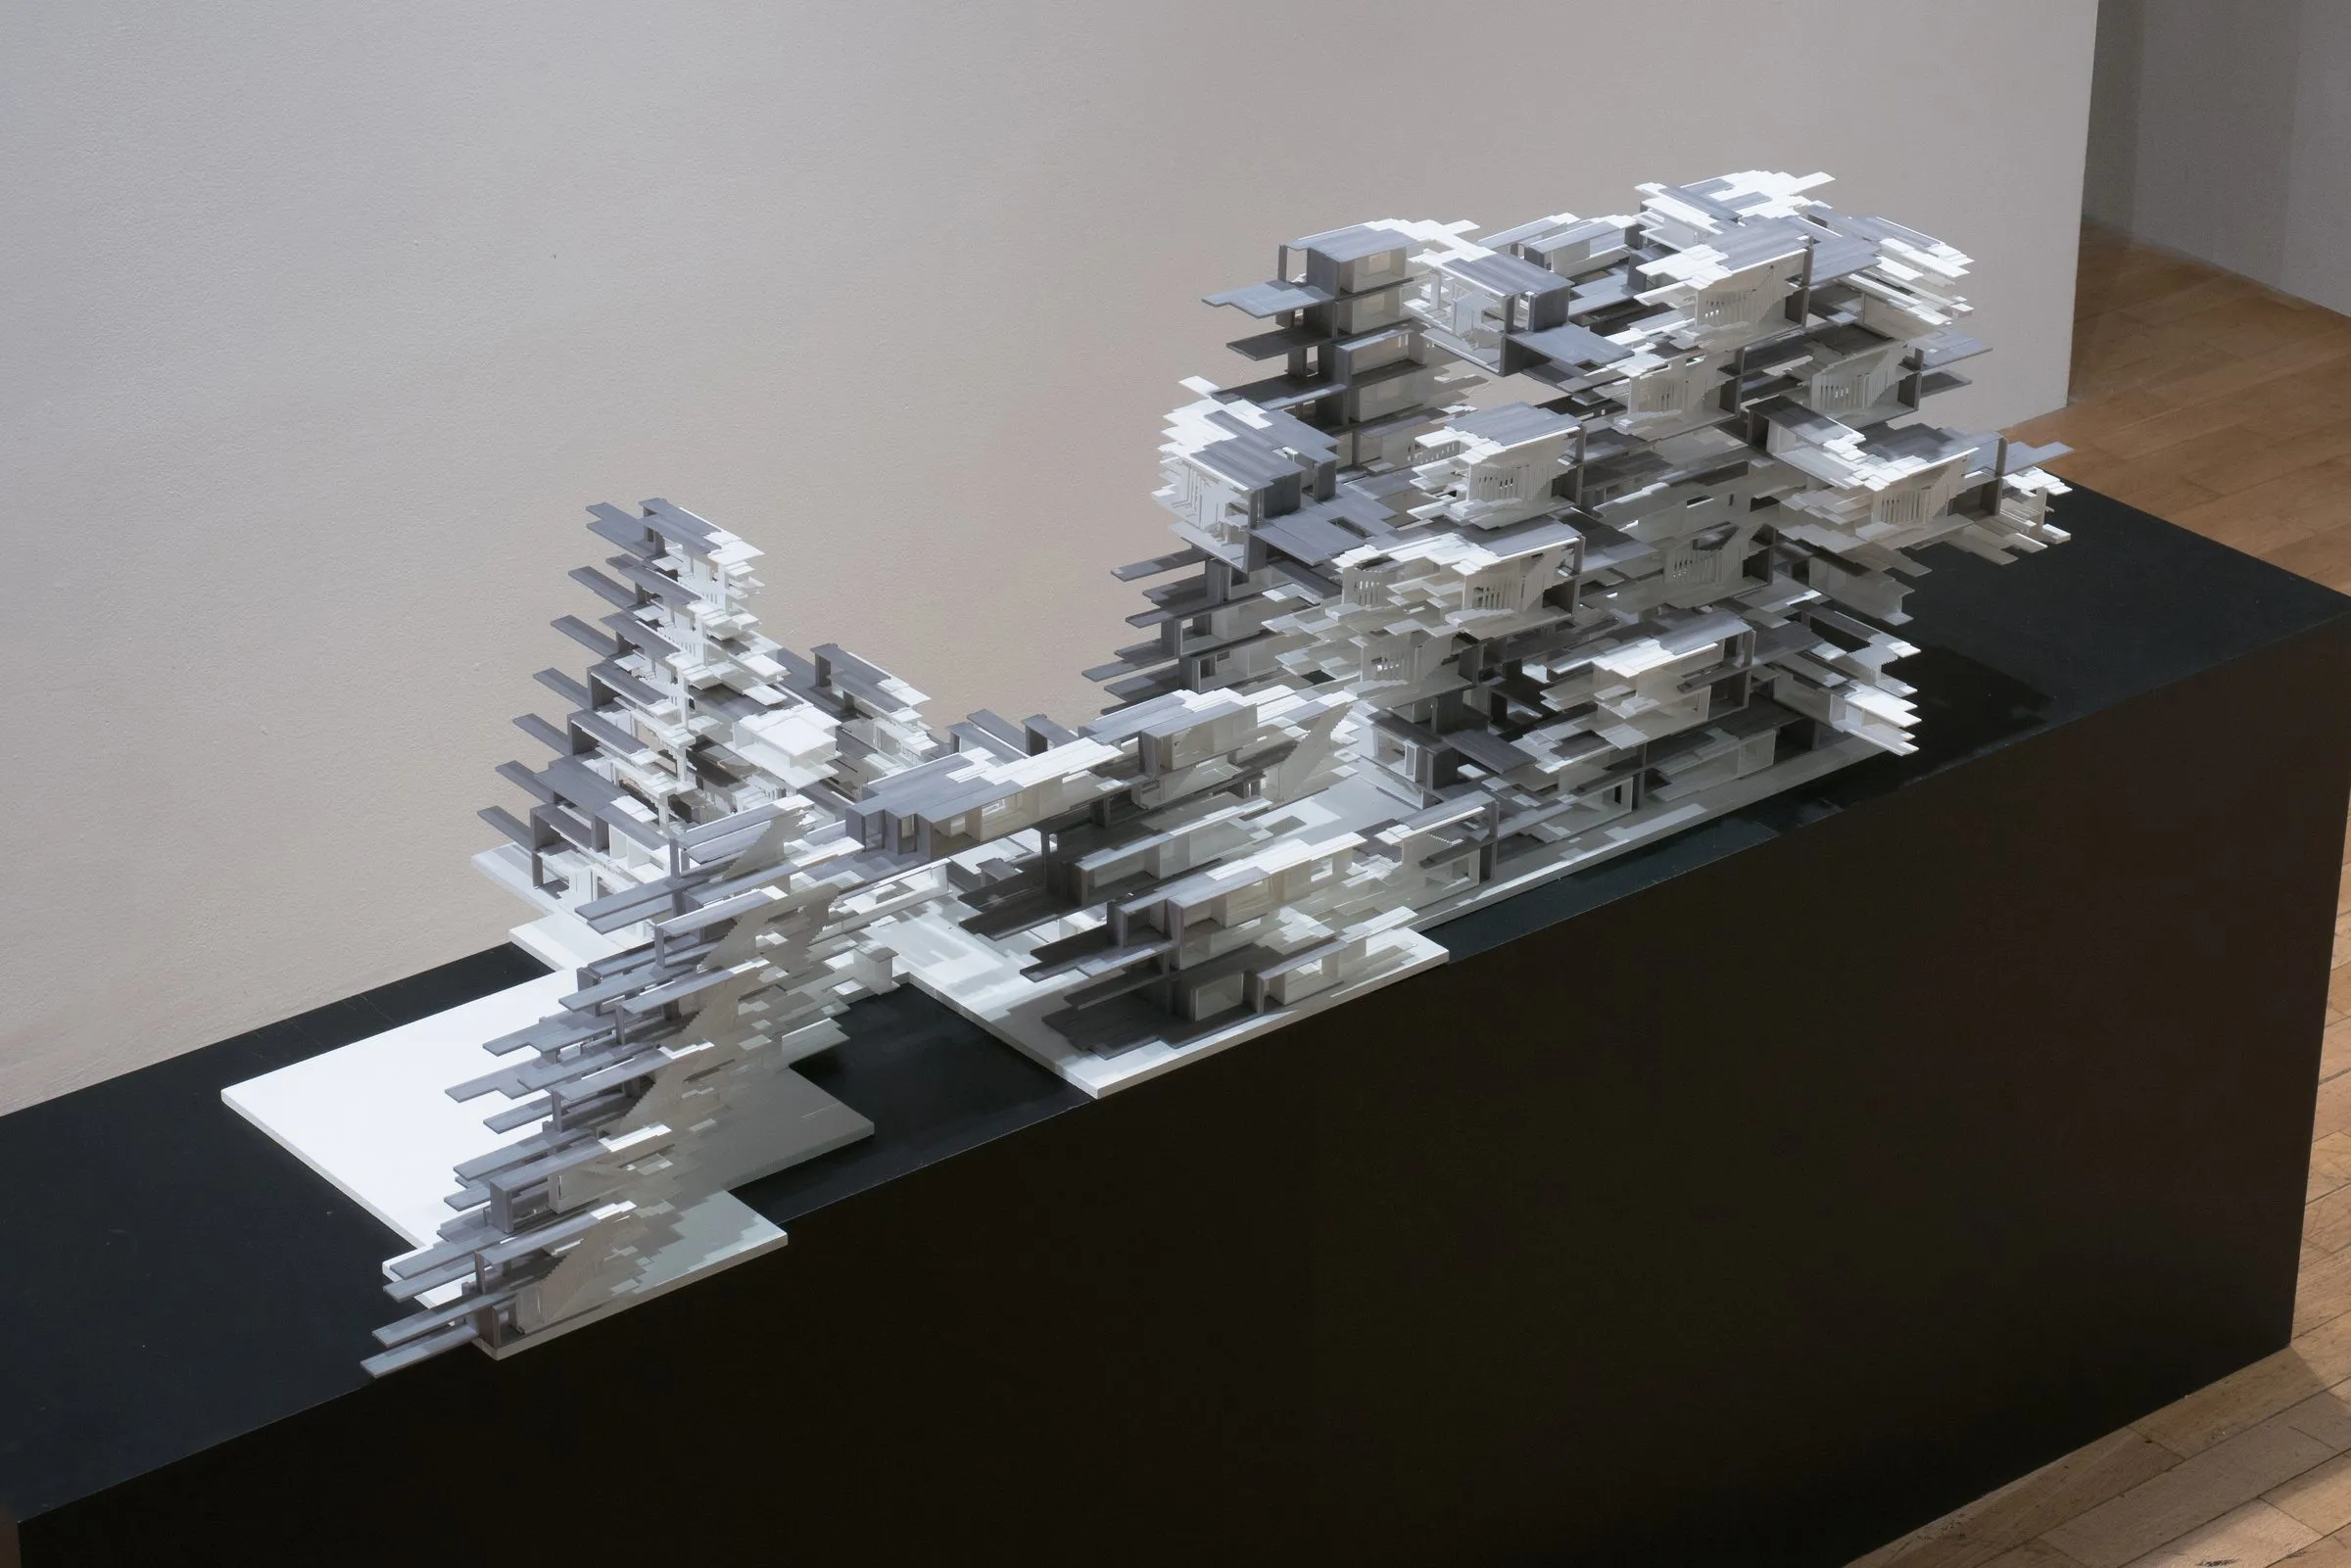
Two drawings carry the work, both made from the city’s own building footprints at one inch to one kilometre. The first gathers the paved area built in Austin in 2018, streets excluded, into one field: about thirty per cent larger than the space built for people that year. The second draws the forest that would absorb one year of Austin’s emissions as a field of squares of one square kilometre each. Printed at 19 by 2 metres, the work became the background of Large City Architecture Research, the exhibition Rasa Navasaityte and I curated at the Mebane Gallery of The University of Texas at Austin from January 19 to April 15, 2022: the print ran along the gallery walls behind the cardboard scaffold and the white models, and the exhibition text put the numbers on the wall. Fourteen million nine hundred eight thousand eight hundred fifty-six acres of forest compensate Austin’s CO2 emissions related to the built environment; if everyone lived in an urban fabric like Austin, it would take three and a half forested planets only to sink the carbon emitted through how we build, place and comfort our homes; one household in West Austin alone emits 80 tons of CO2 per year. I presented the work as The One Year City, Austin’s data drawn by architecture, at UT GIS Day on November 17, 2021, and a video belongs to the installation.
The method is the one that later scaled to 5,856 cities: ask a plain question, answer it with the whole dataset, and draw the answer at the size it deserves.
Gallery
3 plates · click to enlarge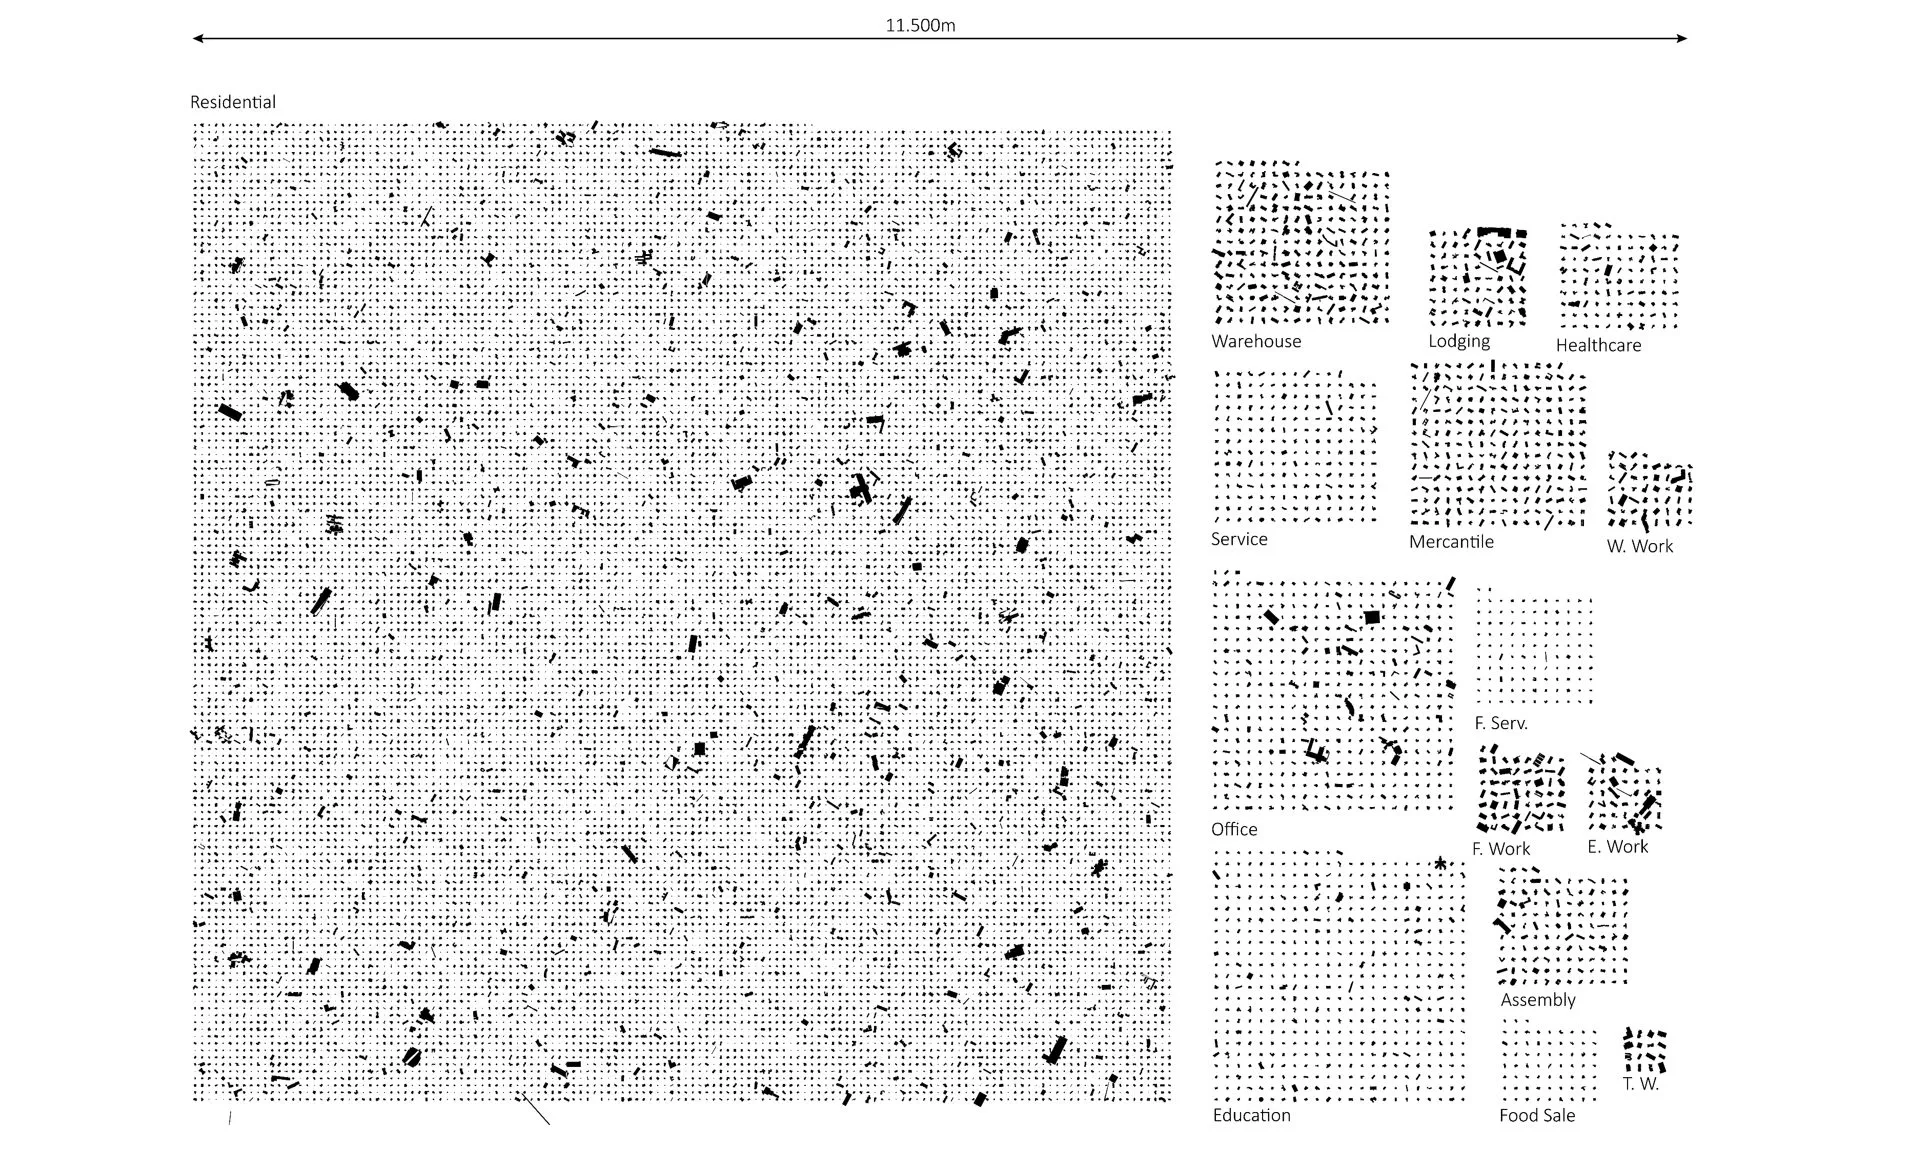
Built in one year in Austin · drawing · 2021 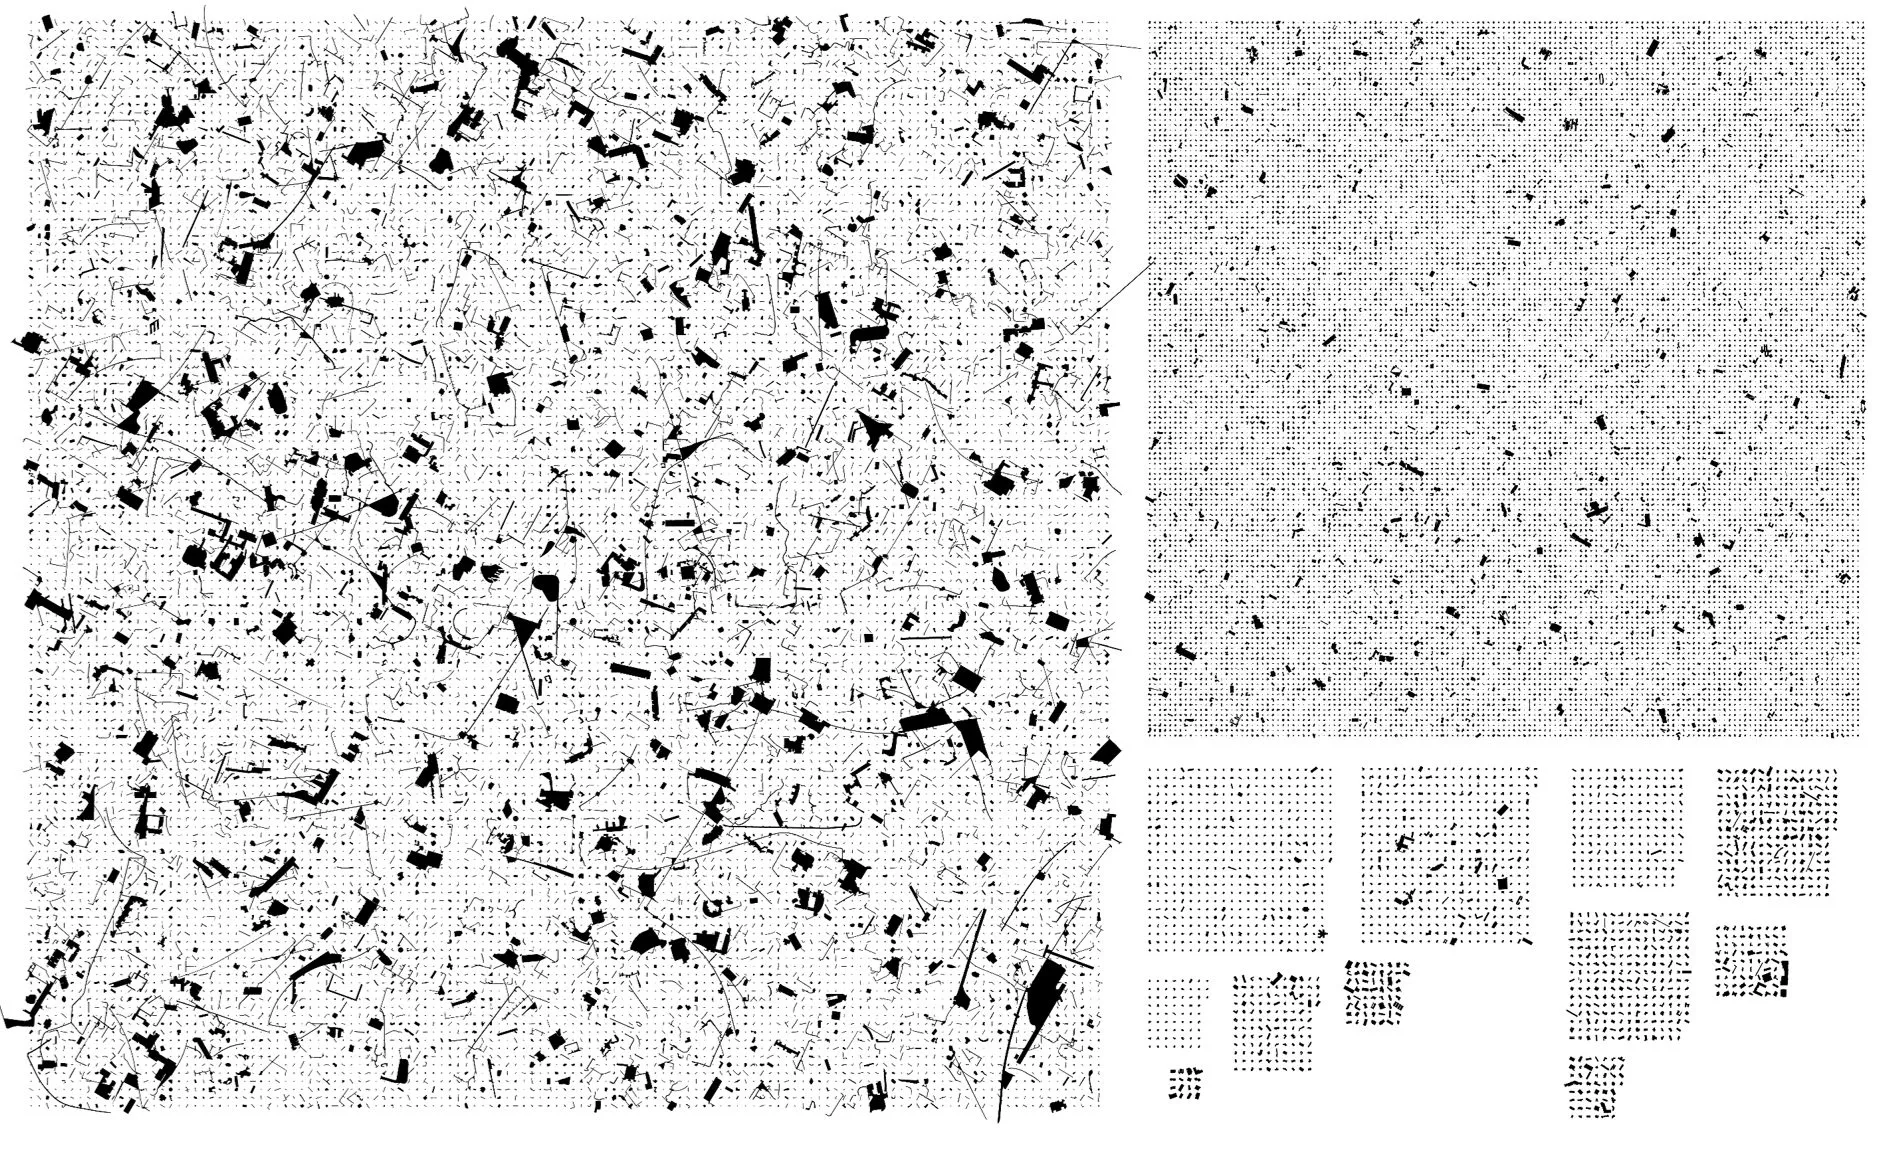
Paved versus built · drawing · 2021 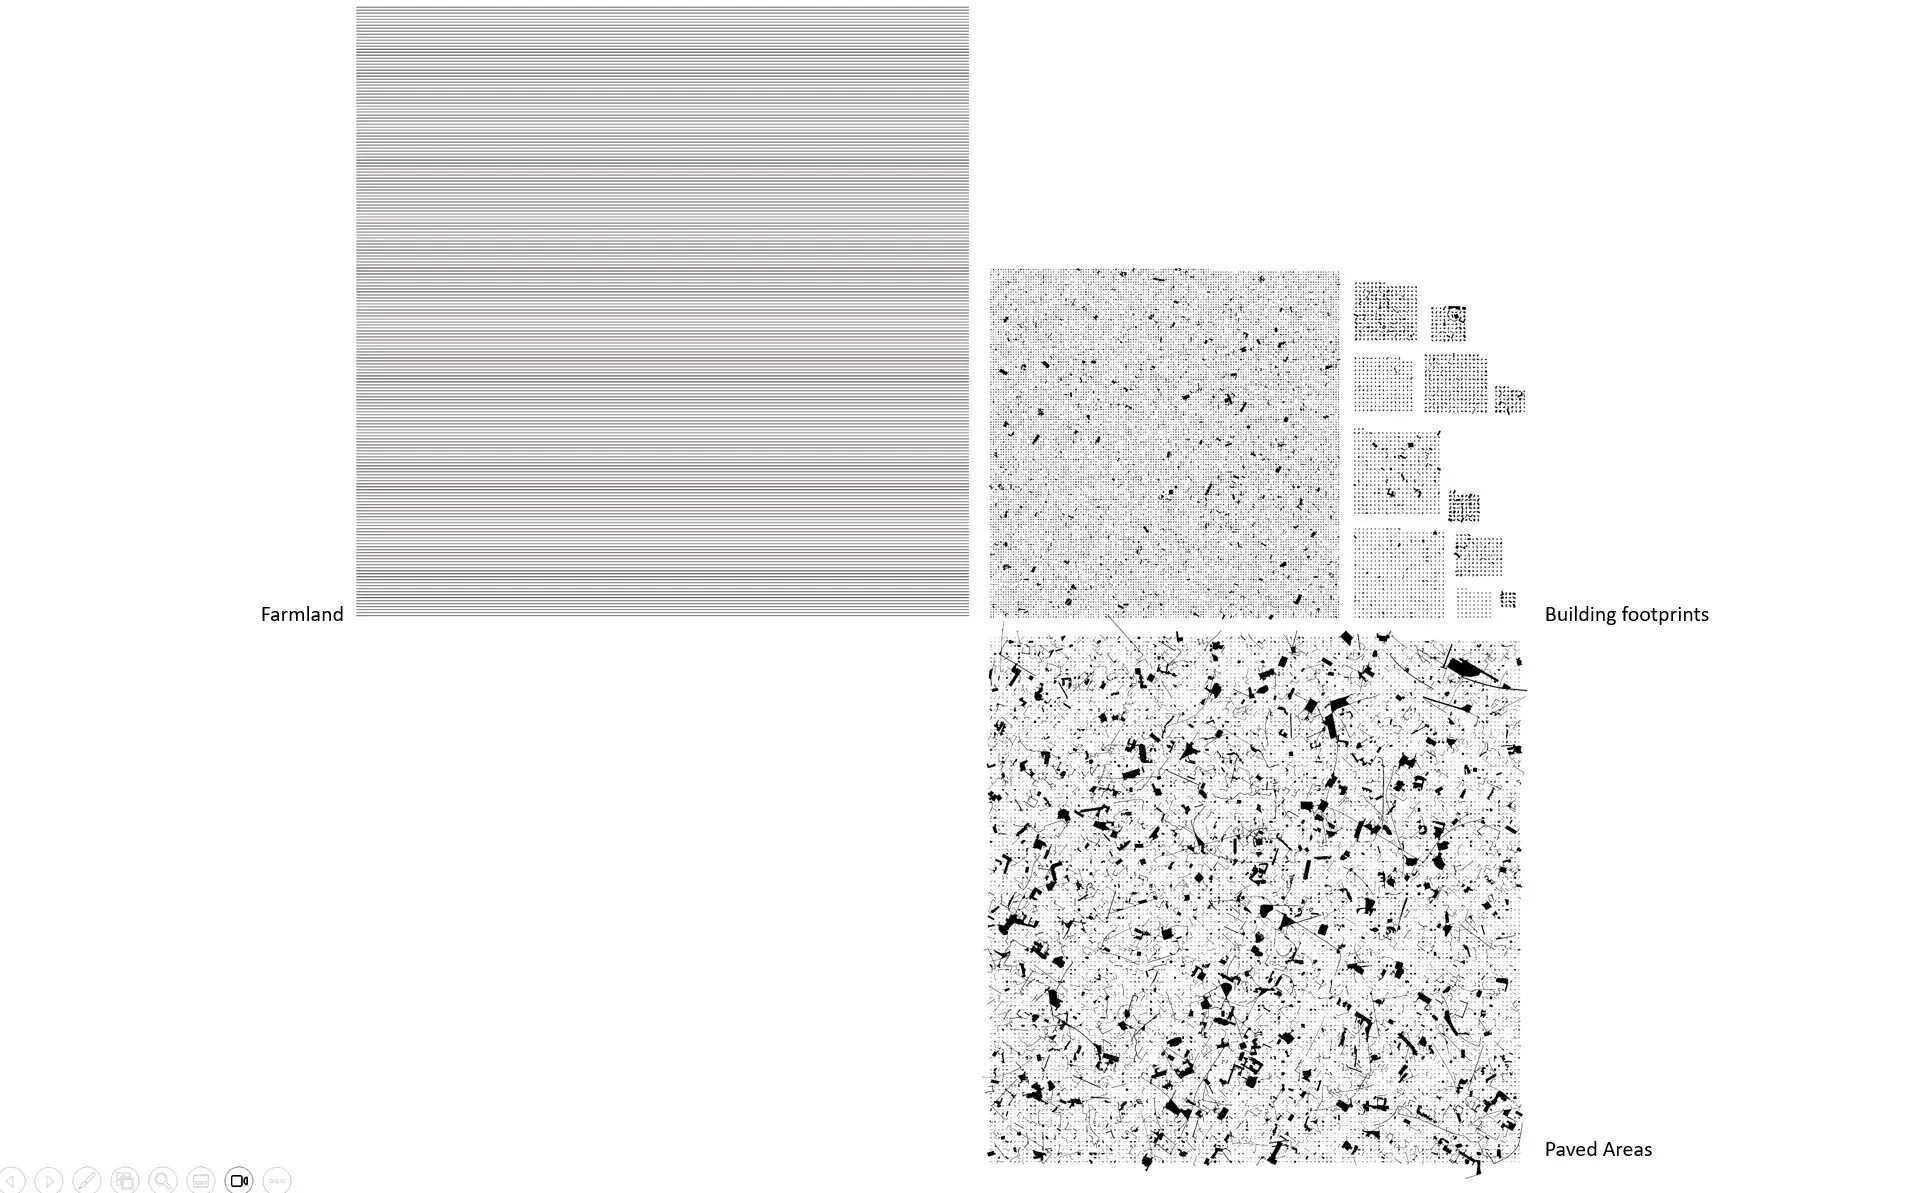
Paved, built and farmland · drawing · 2021
Related
4 entries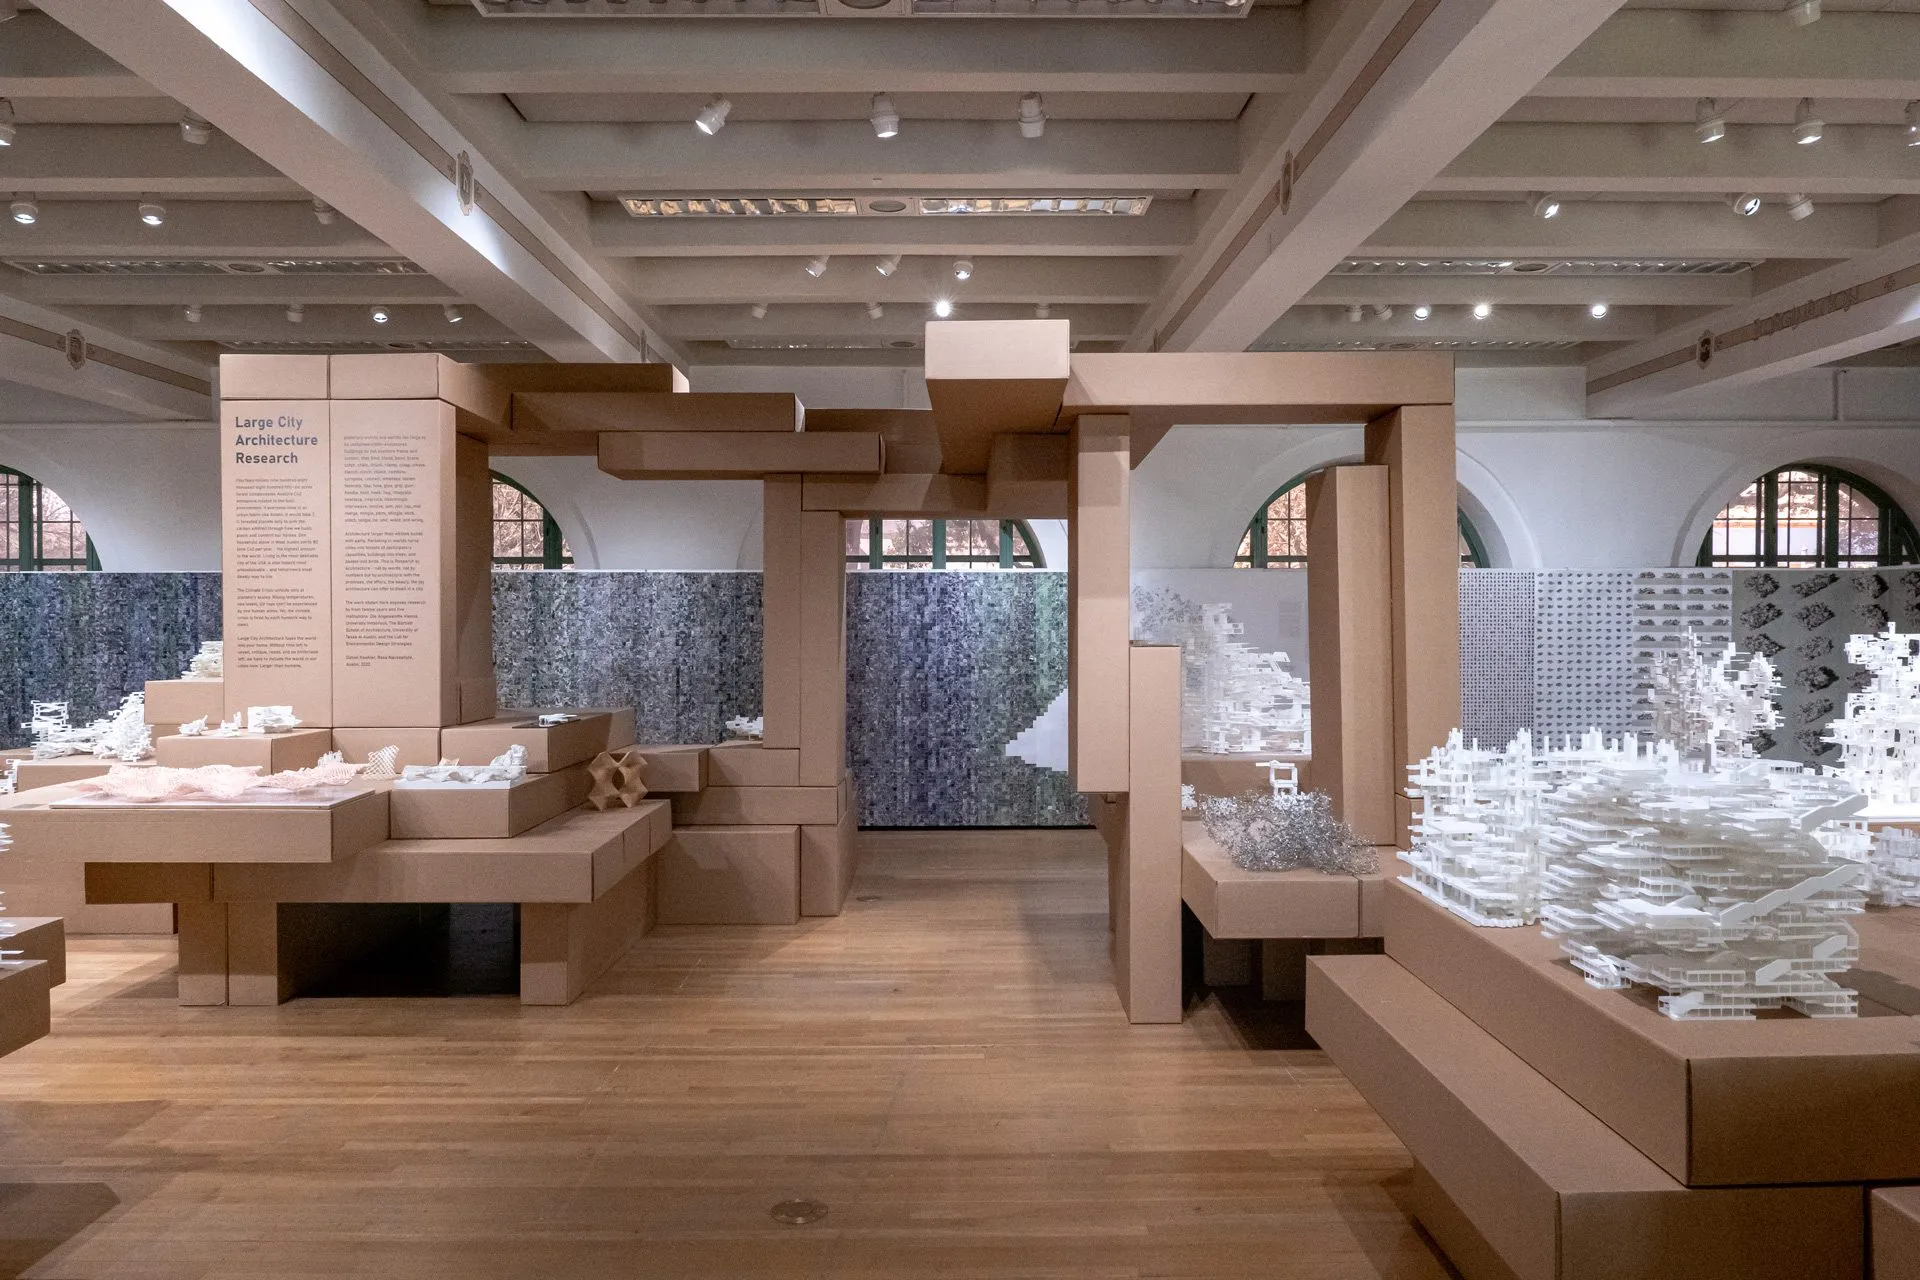

More work
34 entries